Are you tired of dealing with server crashes, downtime, and slow response time? Join the club.
Server monitoring and maintenance is key to keeping your organization running smoothly, but it's notoriously difficult to manage. That's why it's important to have the right tools in place for server performance monitoring and uptime tracking.
Not sure which tool to choose? You're in the right place.
In this article, we'll be going over eight of the best server performance monitoring tools available—including Hyperping, of course. Each tool has its own unique features and use cases, so be sure to read on to find the best fit for your organization.
What Is a Server Performance Monitoring Tool?
Before we get to the tools, let's quickly recap what server performance monitoring is—and why you should care.
Server performance monitoring tools (or SPMs) are used to monitor the health of servers, applications, and networks. It works by recording metrics and variables associated with server performance, like:
- memory usage
- CPU utilization
- disk I/O
- network traffic
- server availability
- system logs
By collecting this data, it's possible to detect (and address) performance issues before they become critical, user-impacting events. This not only improves the overall efficiency of the system, but it can also increase customer satisfaction, decrease churn, and ultimately—increase revenue.
Criteria to Consider When Choosing a Server Performance Monitoring
When choosing a server performance monitoring tool, make sure you at least think about the following criteria:
- Scalability — The tool should be able to scale with your organization’s growth and changing needs. Look for a solution that can handle an increasing number of servers, applications, and networks without overloading your network or requiring you to purchase additional licenses.
- Automation — Choose a tool that automates as many tedious, time-consuming processes as possible. That includes alerting, incident resolution, and periodic checks.
- Integration — Make sure the SPM tool you choose can integrate with your existing tools. One common example is integrating your SPM tool with your status page service for quicker notifications and updates. That's not an issue for Hyperping users—but more on that later!
8 Best Server Performance Monitoring
Before we dive into the in-depth coverage of the tools, here's the TLDR version:
- Hyperping — Best for Simplifying Server Monitoring and Status Page Management
- Sematext — Best for Quickly Troubleshooting Server Issues
- Nagios XI — Best for Scaling Infrastructure
- Site24x7 — Best for Comprehensive Cloud Monitoring
- Atera — Best for Managed Service Providers (MSPs)
- Opsview — Best for Customization and Flexibility
- SolarWinds — Best for Network Performance Monitoring
- New Relic — Best for Application Performance Monitoring and Analytics
If you want to dive into the specifics of what makes these tools great—read on!
1. Hyperping: Best for Simplifying Server Monitoring and Status Page Management
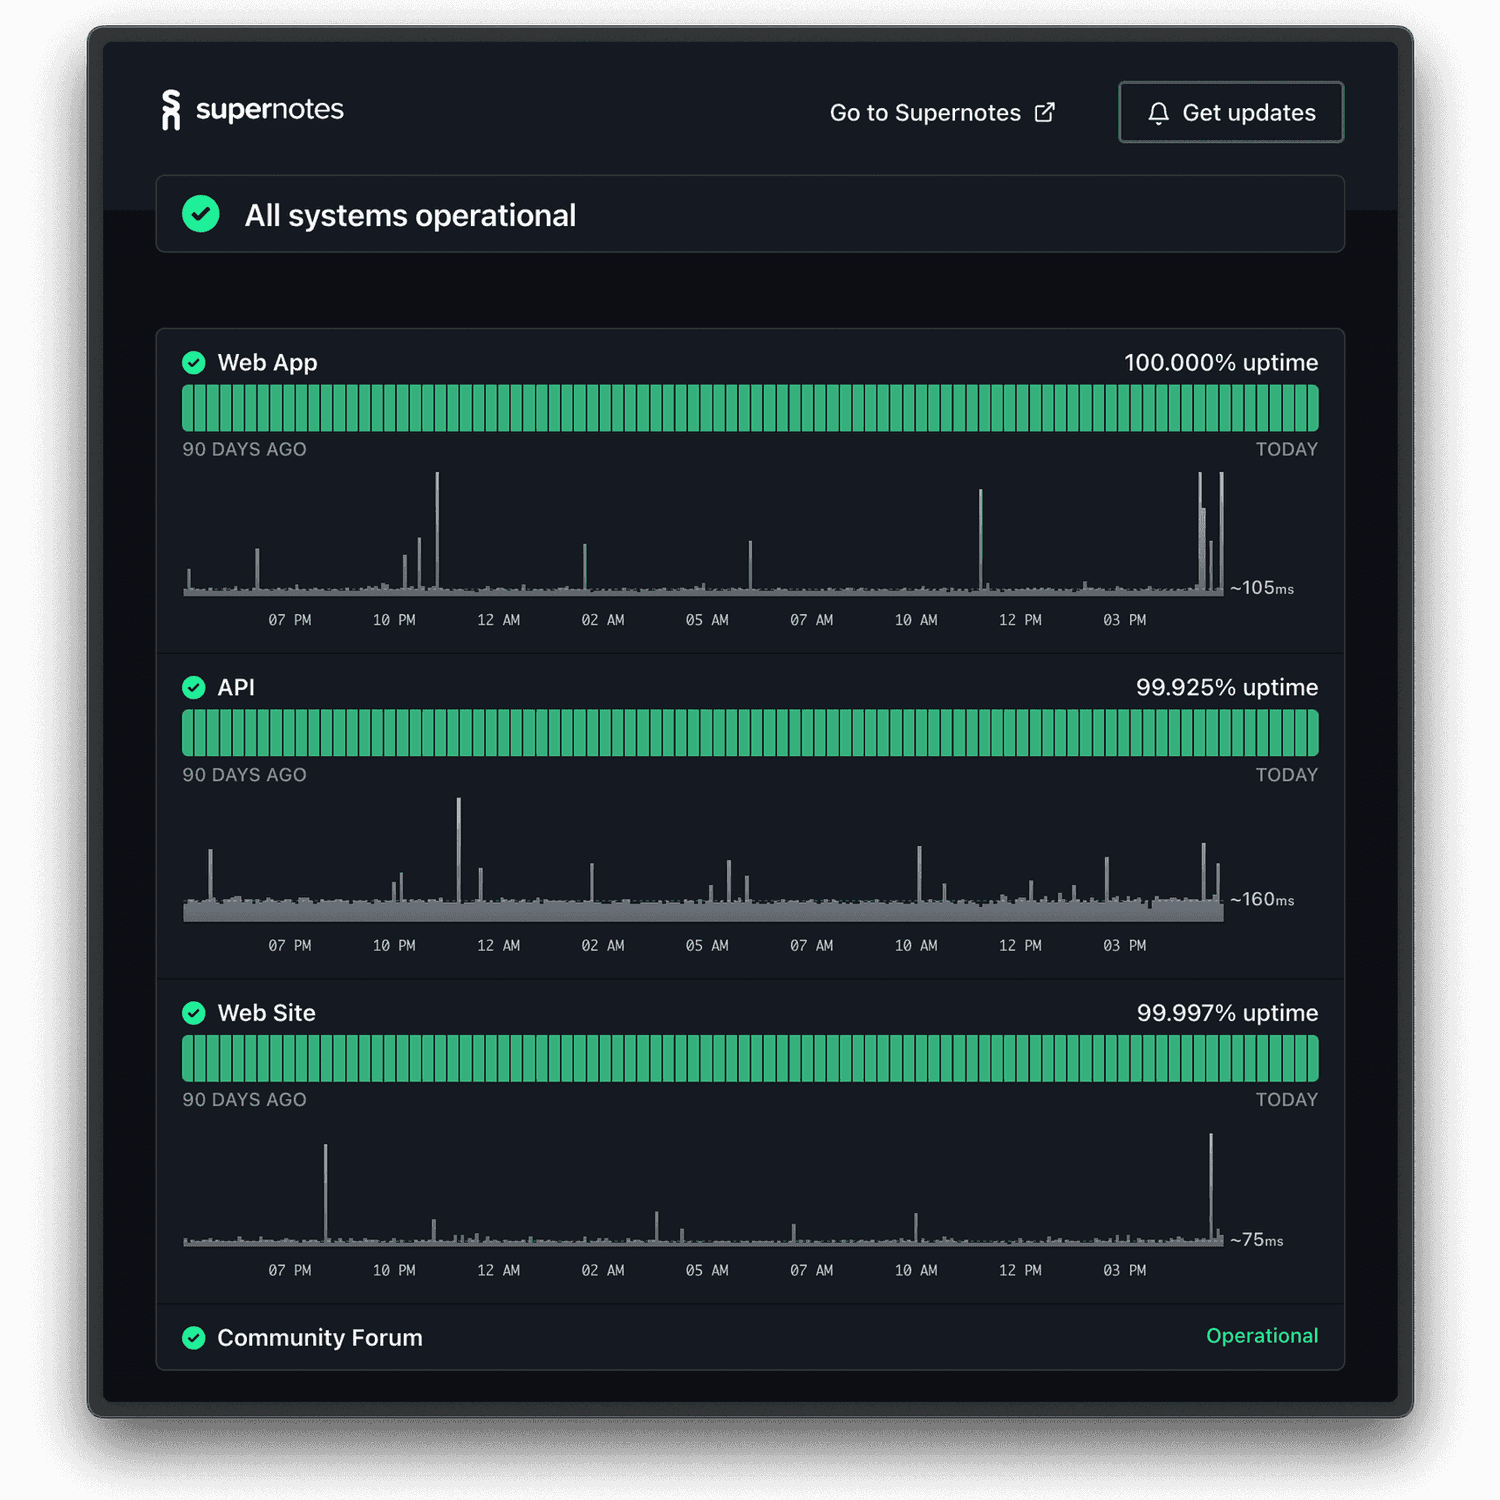
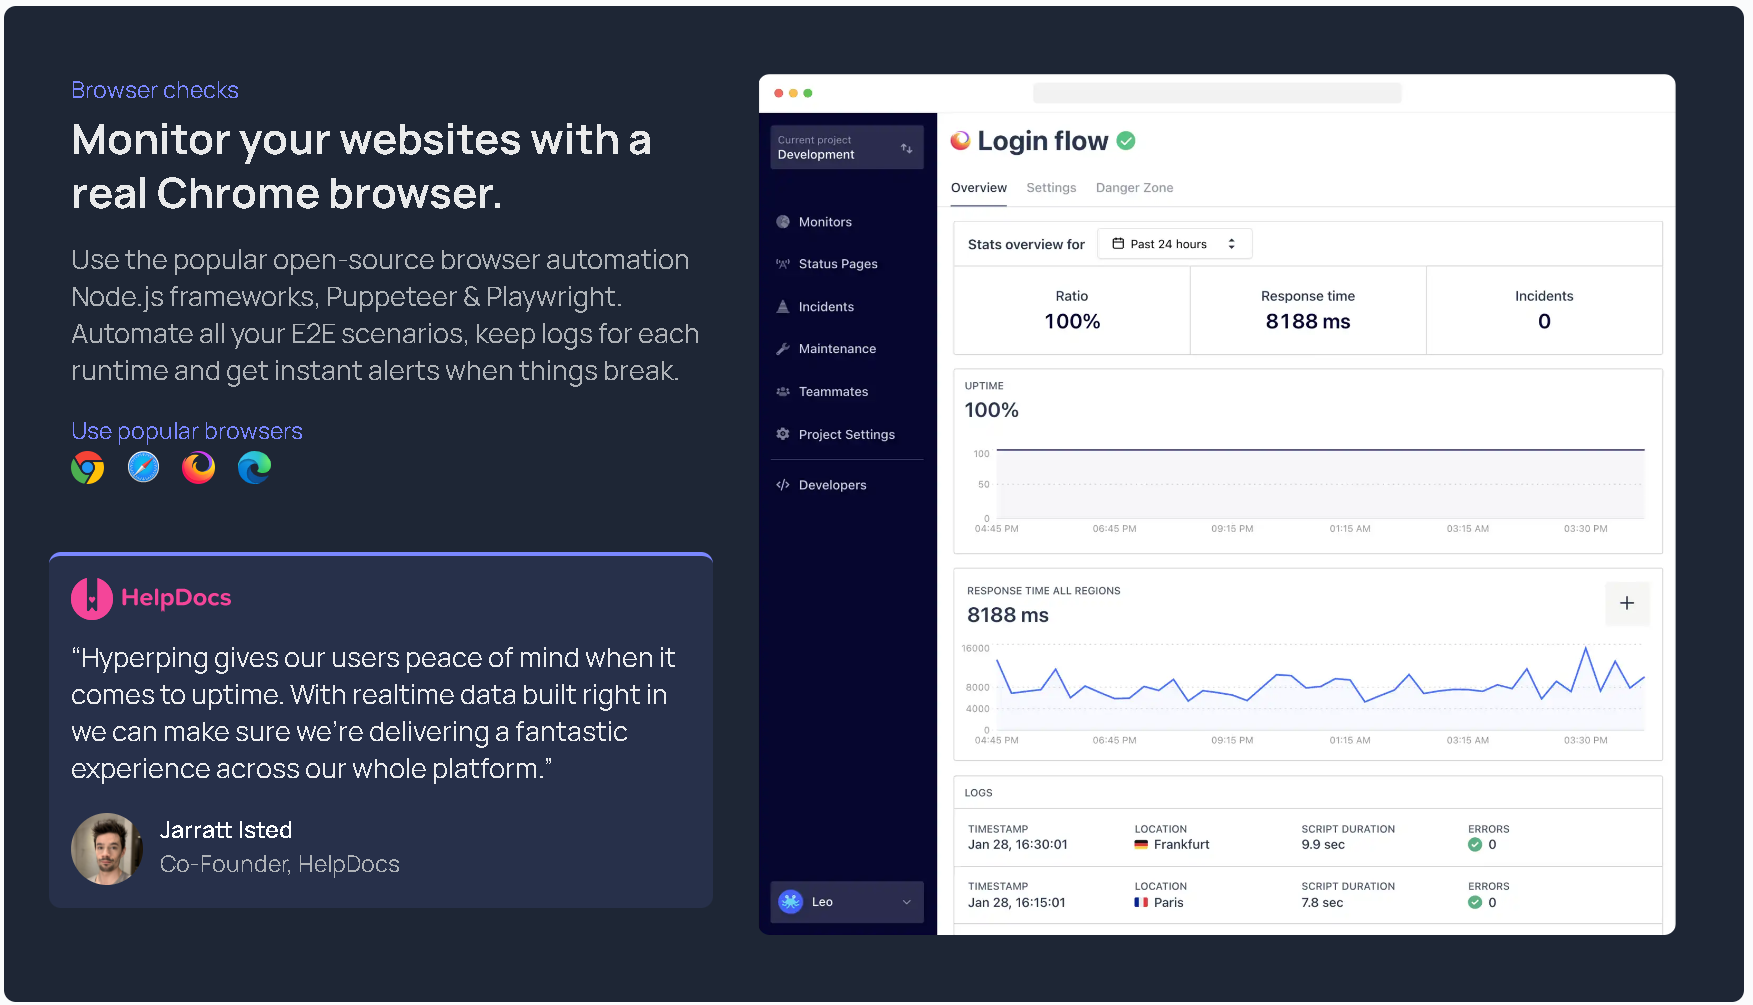
Hyperping stands out in a sea of single-purpose tools by offering a status page service with built-in server performance monitoring and incident management. It combines reliable uptime monitoring, elegant status pages, and incident management—all in one powerful tool.
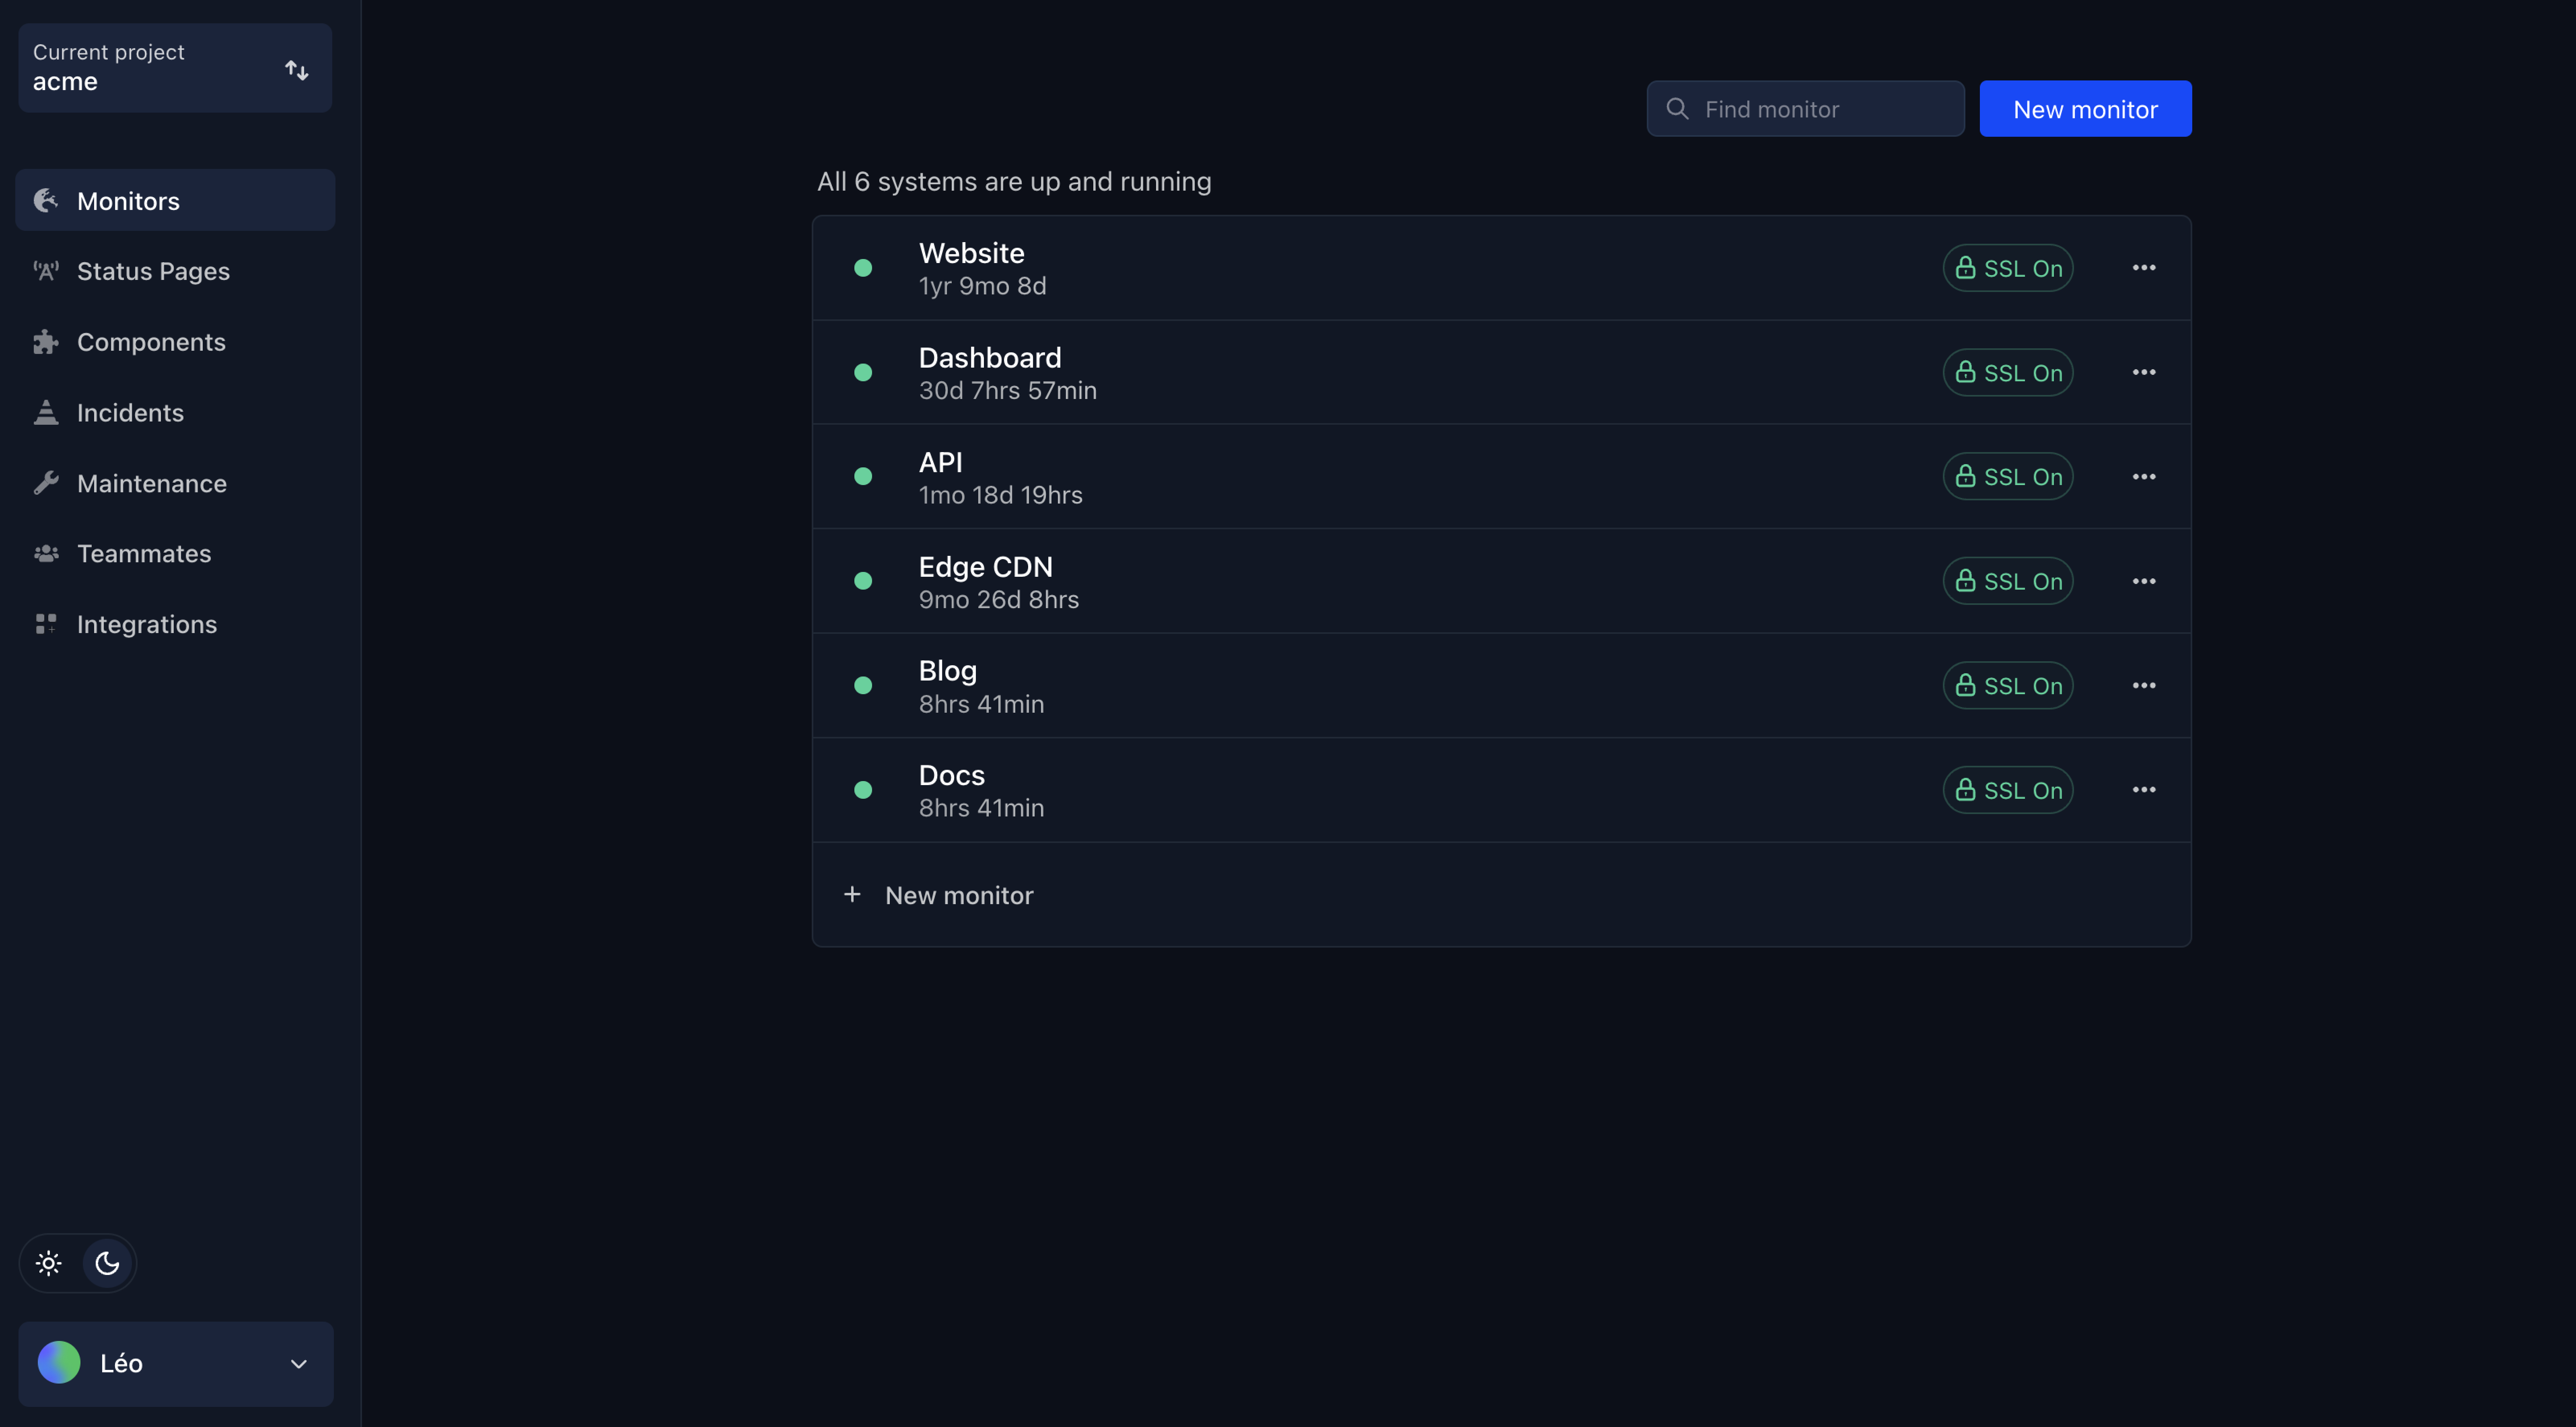
The tool was built with simplicity and usability in mind—it has a clean UI and prioritizes features that your team actually needs. It's especially useful for teams that need to quickly monitor servers and immediately alert users when there's a problem.
Key Features
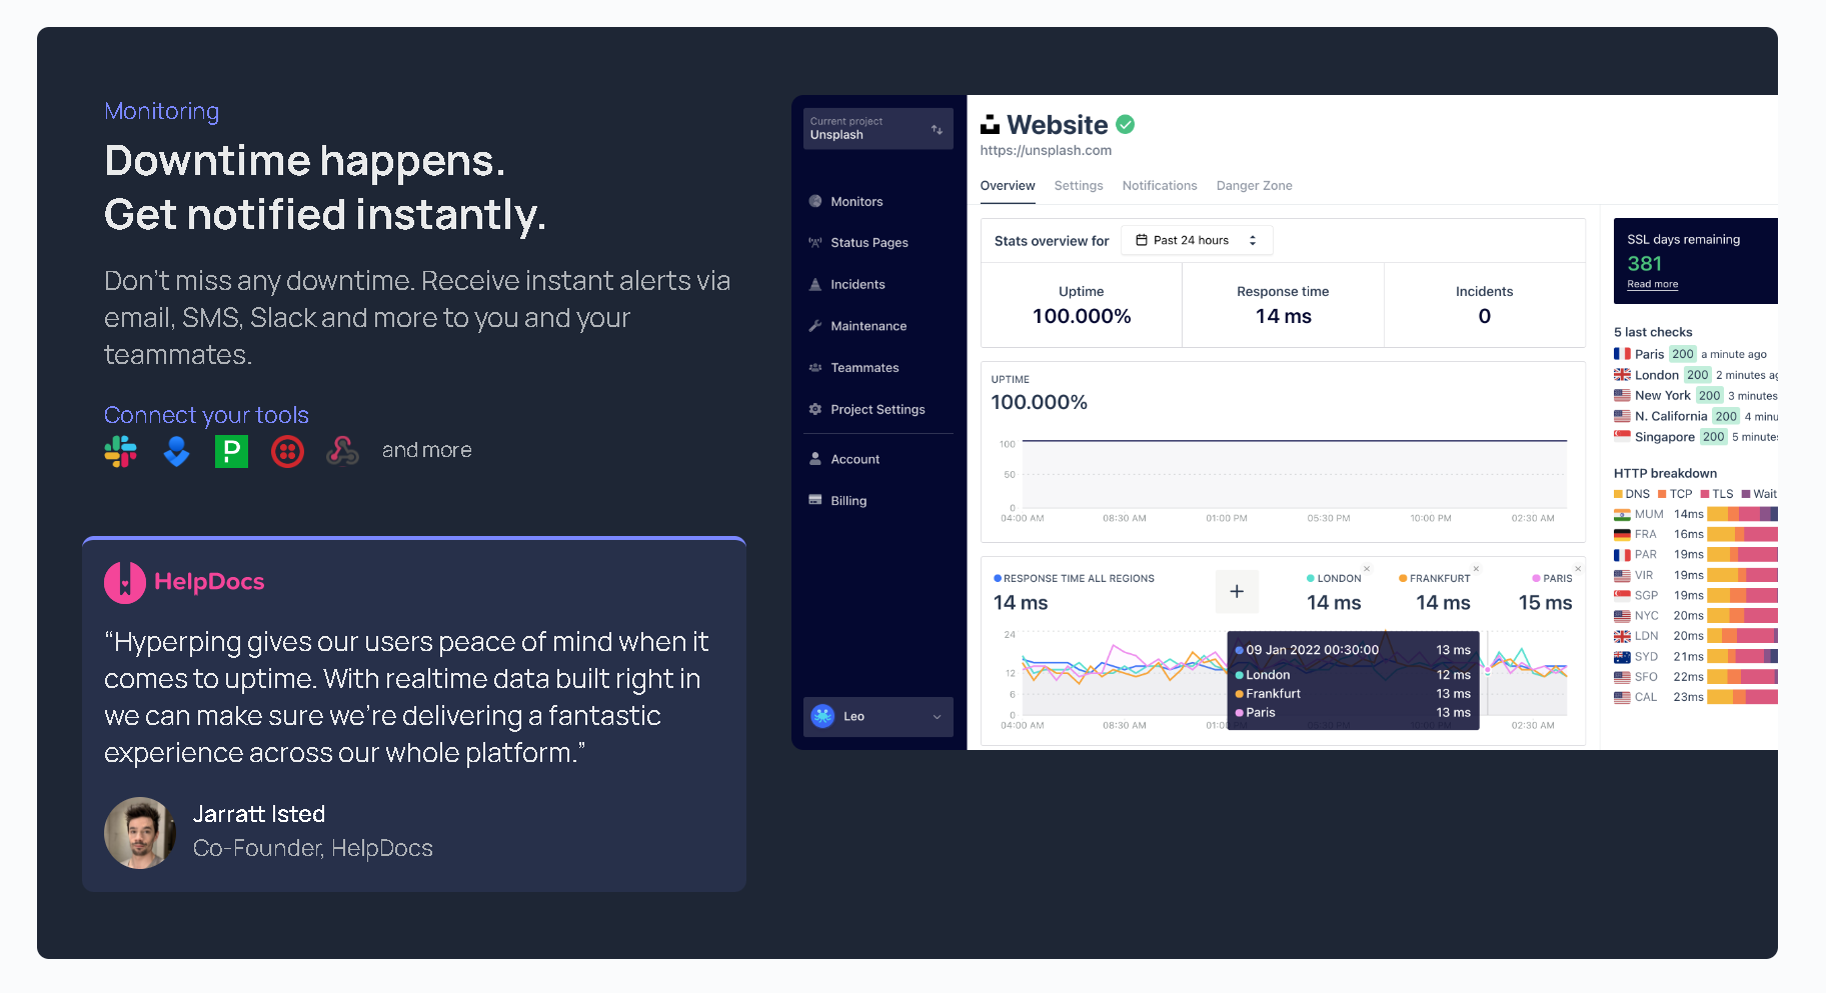
- Real-Time Alerts — Receive alerts via SMS, email, Slack, and more when a server experiences performance issues.
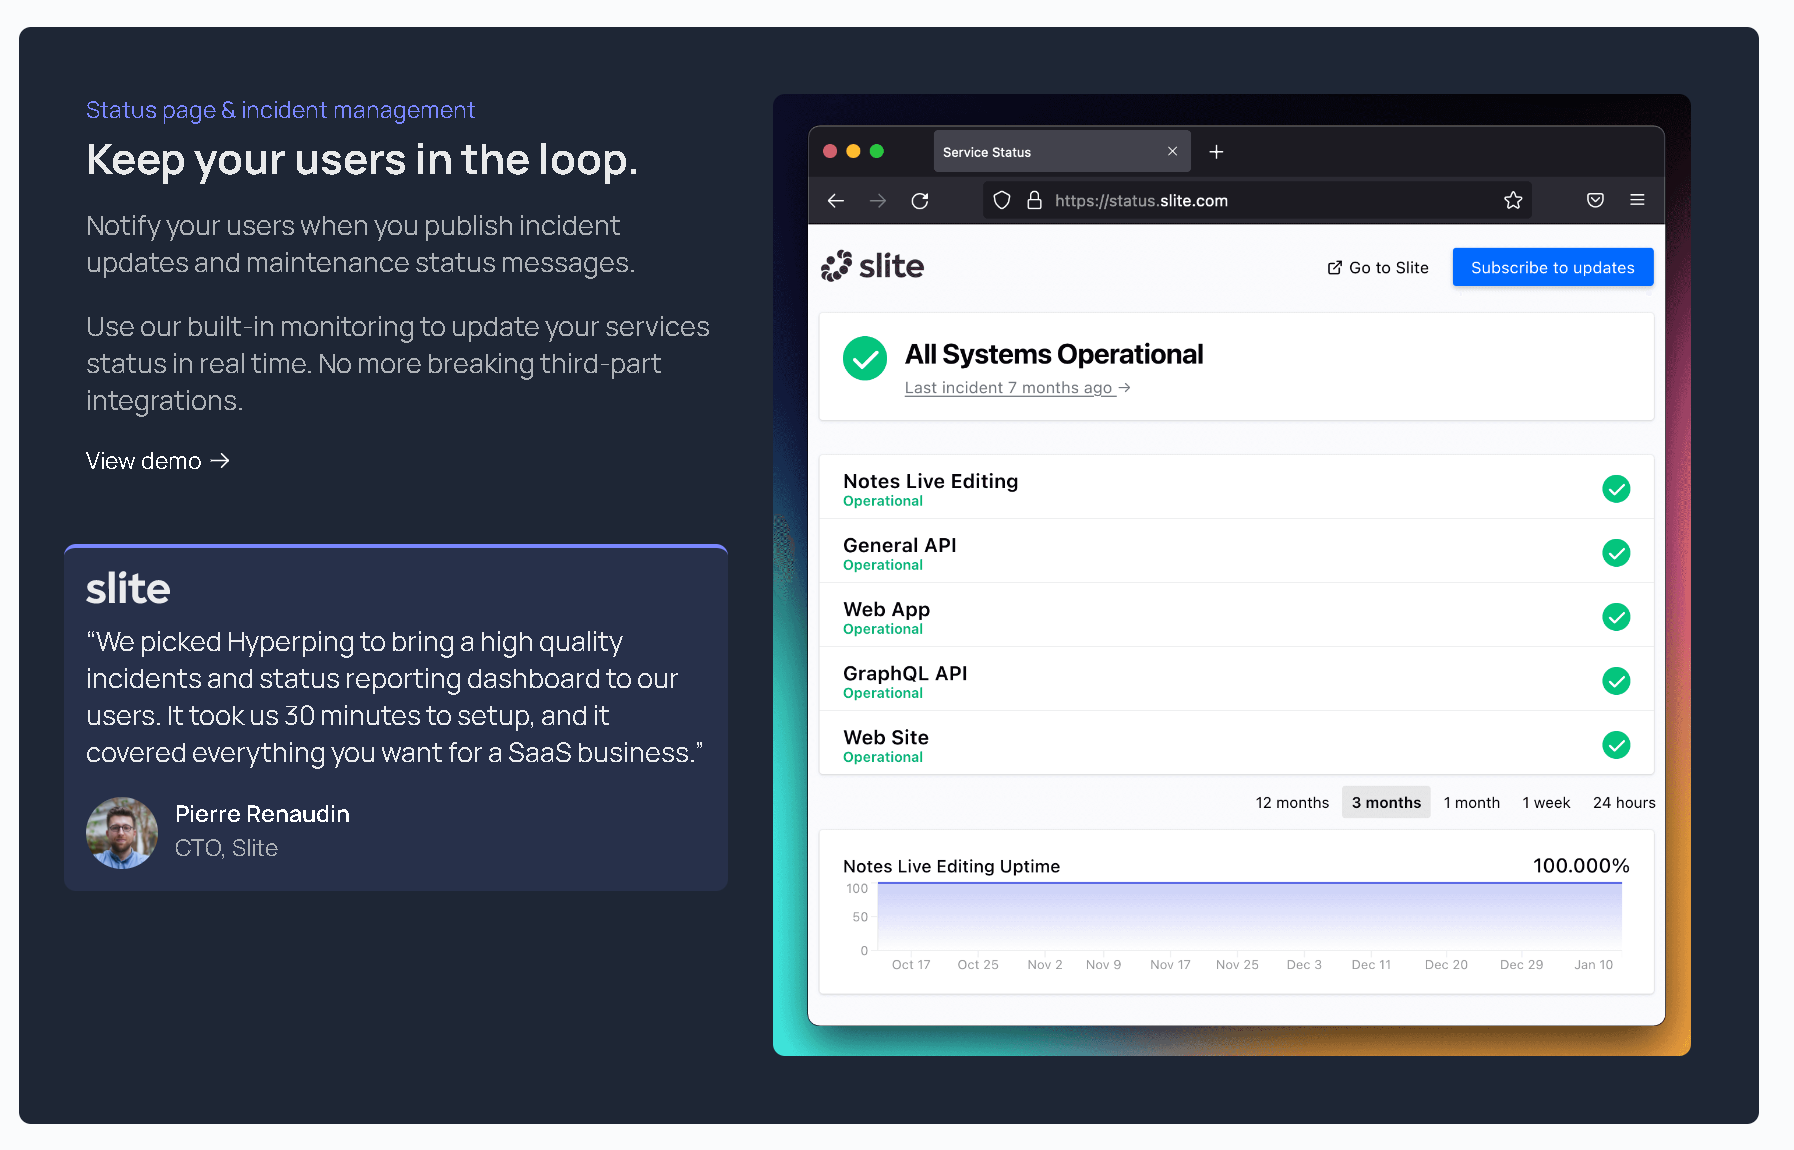
- Integrated Status Pages — Instantly post status updates to your Hyperping status page and keep users informed about server outages and issues.
- Synthetic Monitoring — Monitor the uptime and performance of your sites, APIs and servers, with a simple and elegant interface.
- Tons of Flexibility — Change the methods, parameters, and headers of your HTTP monitors, add teammates, create unlimited projects, and control status page access.
Pricing
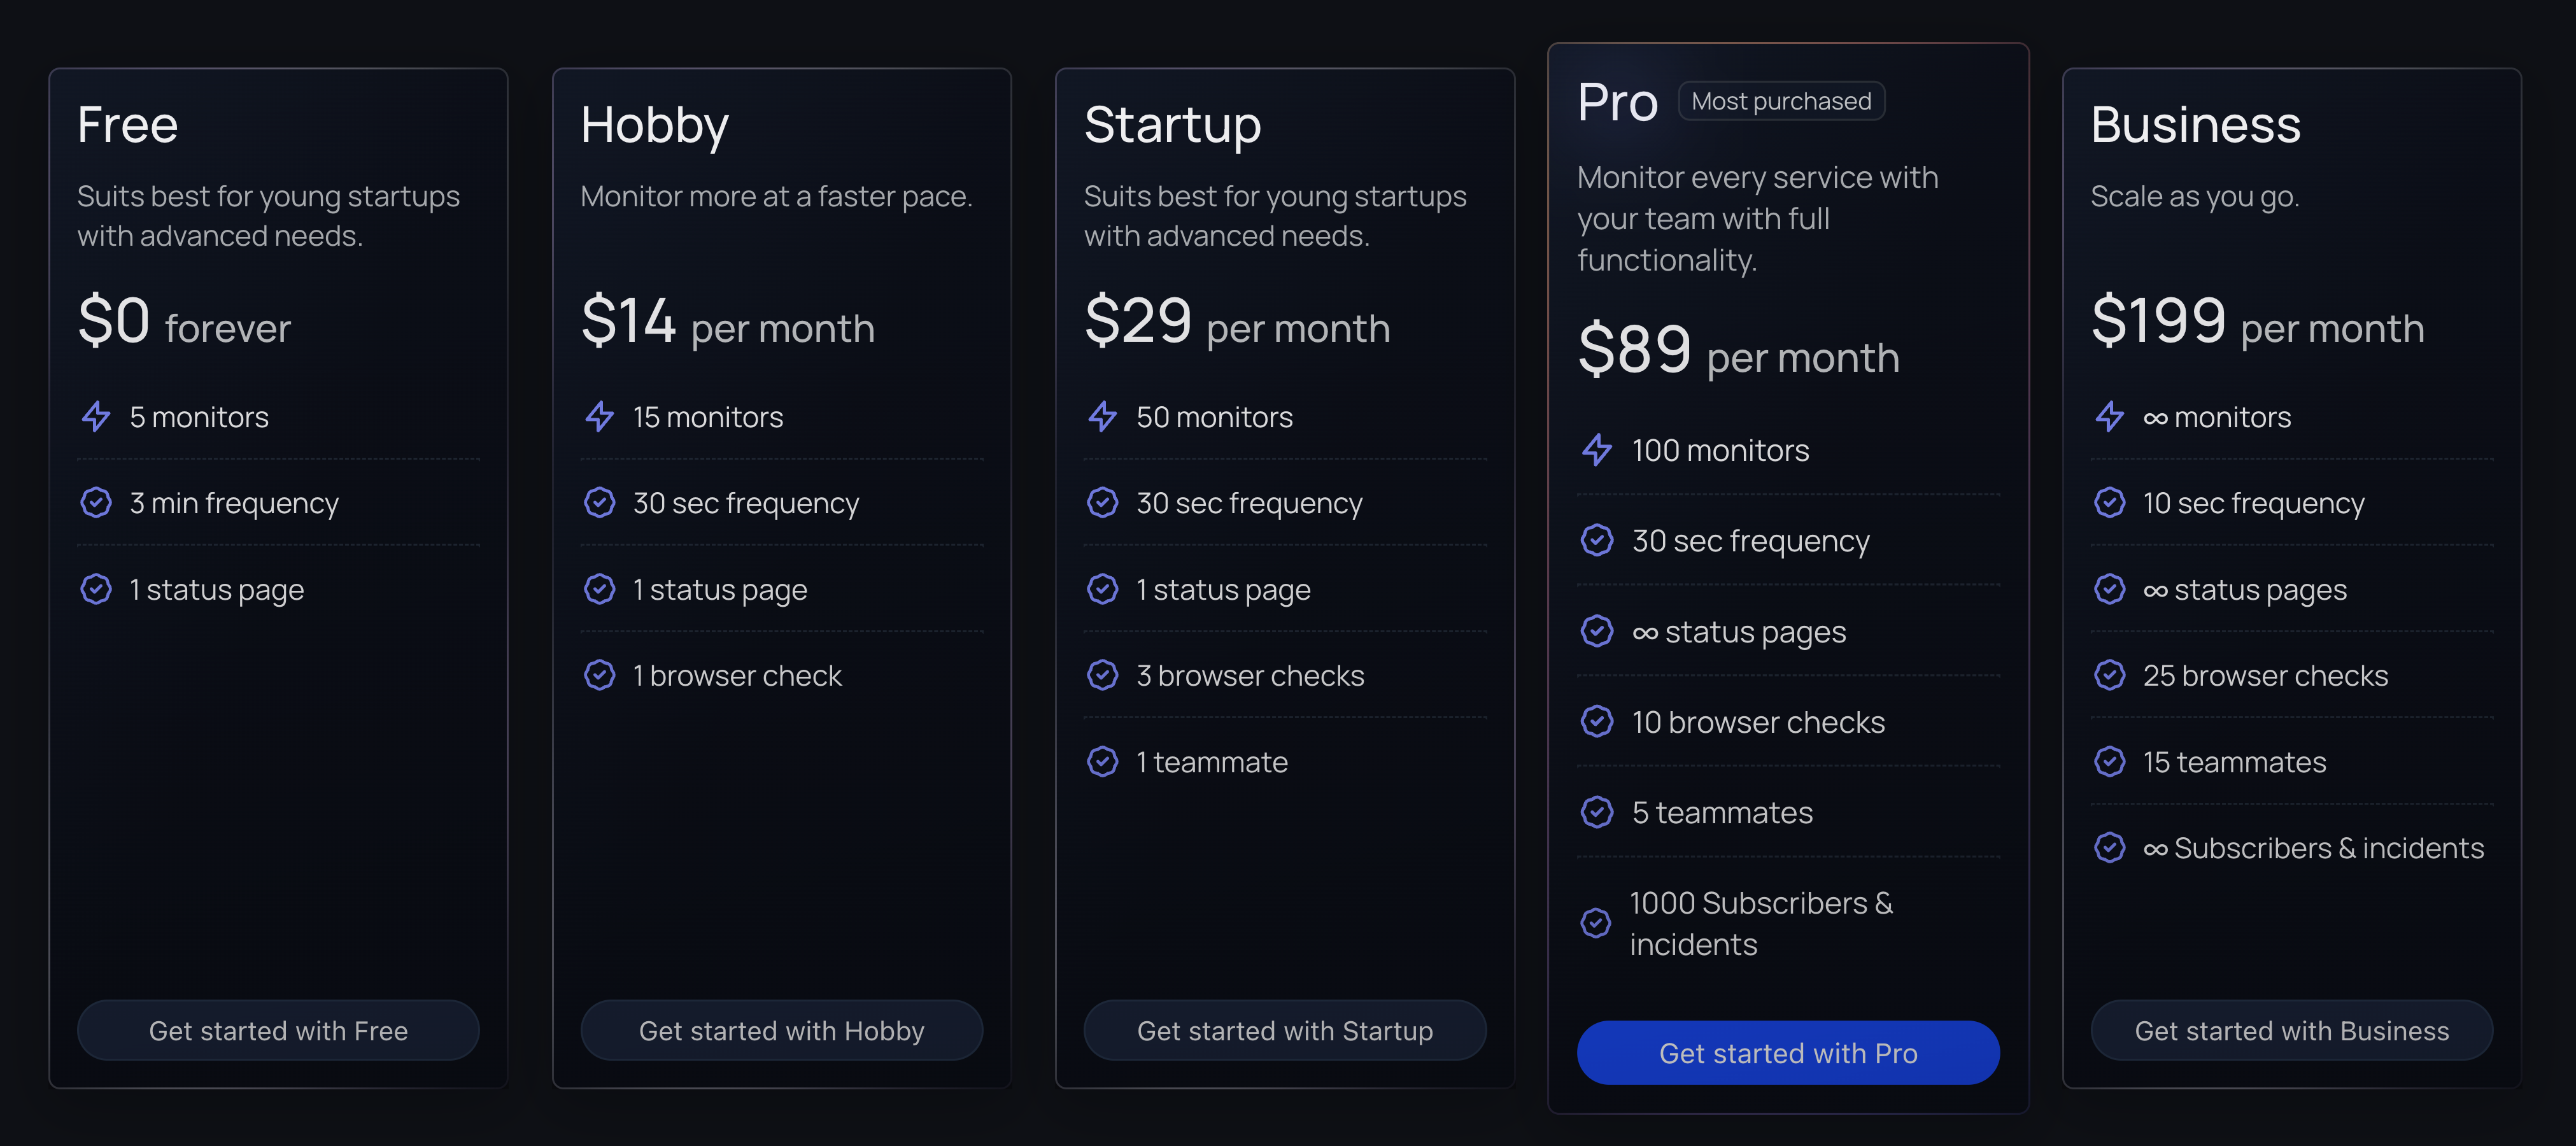
Hyperping Free is great for basic, reliable server performance monitoring tool—you can create five custom monitors with a 3-minute update frequency. If you want more monitors or faster updates, you can upgrade to Hobby ($14/month), Startup ($29/month), or Pro ($89/month).
Pros and Cons
Pros
- Consolidates monitoring and status page tools, reducing the need for multiple tools.
- Offers integrations with other tools such as Slack, PagerDuty, and more.
- Provides reliable uptime monitoring and incident management capabilities.
Cons
- Lacks some more advanced monitoring capabilities (e.g., log monitoring).
2. Sematext: Best for Quickly Troubleshooting Server Issues
Sematext is an all-in-one observability platform with some powerful troubleshooting features.
With Sematext, you can track tons of metrics that contextualize the past and present utilization of your servers and cloud instances. It also provides visualizations and alerts to help you quickly identify any potential problems—perfect for troubleshooting issues as they arise.
Key Features
- Advanced Filtering — Filter your server metrics based on labels, tags, and more.
- Server Events — Easily track operating system events related to the performance of your servers.
- Real-Time Alerts — Receive real-time notifications when server performance issues occur or custom thresholds are reached.
Pricing
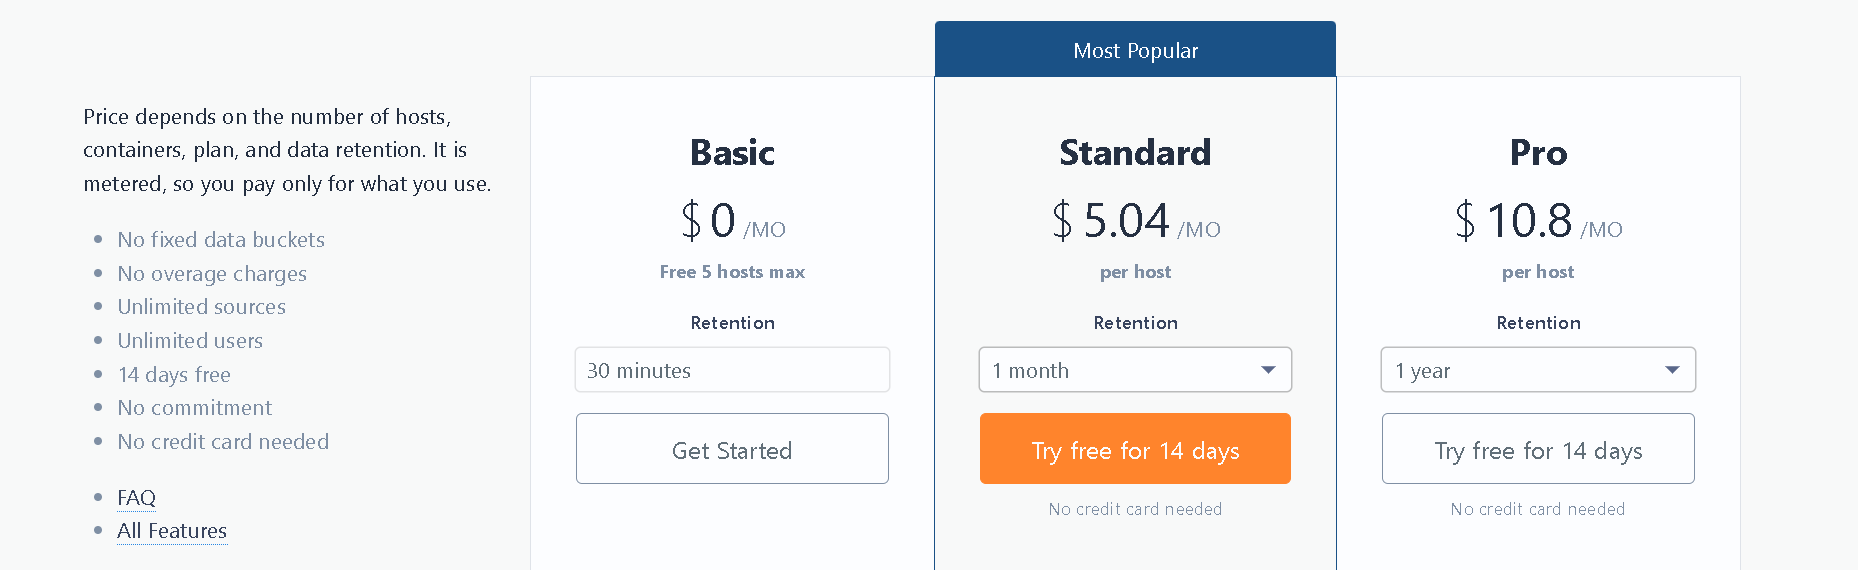
Sematext Basic is free, and grants you 30-minute data retention for up to five hosts. If you need more than that, you’ll need to upgrade to Standard ($5.04/host/month) for 1-month retention or Pro ($10.80/host/month) for 1-year retention.
Pros and Cons
Pros
- Offers a wide range of monitoring capabilities.
- Provides real-time alerts for performance issues and errors.
- Offers integrations with other tools such as Slack, PagerDuty, and more.
Cons
- Can be overwhelming for teams who are new to monitoring and logging.
- Pricing can be higher compared to some other tools on the market.
- User interface could use some improvement to be more user-friendly.
3. Nagios XI: Best for Scaling Infrastructure
Nagios XI is a powerful monitoring solution for networks, servers, and applications that scales incredibly well.
It provides comprehensive monitoring capabilities, from detailed performance metrics to real-time alerts sent via email or SMS notifications. And like we just mentioned, it's incredibly scalable—you can monitor thousands of servers with a single instance.
Key Features
- Network Monitoring — Comprehensive monitoring of your networks, servers, and applications.
- Real-Time Alerts — Receive real-time alerts via email or SMS when performance issues occur.
- Flexible Dashboards — Customize your dashboards with the metrics that are most important to your organization.
Pricing
Nagios XI is a paid service that prices licenses based on the number of nodes included. There’s a big range in price—the entry-level 100-node license costs $1,995, while the unlimited node license costs $19,995.
You can check out the pricing options here.
Pros and Cons
Pros
- Highly customizable with a wide range of plugins and extensions available.
- Offers comprehensive monitoring capabilities for servers, networks, and applications.
- Provides real-time alerts for performance issues and errors.
Cons
- Can be complex and time-consuming to set up and maintain.
- User interface is outdated and can be difficult to navigate.
- Limited capabilities for log monitoring and analysis.
4. Site24x7: Best for Comprehensive Cloud Monitoring
Site24x7 is a comprehensive cloud monitoring platform that offers real-time alerts and detailed performance metrics for effective troubleshooting.
It's great for tracking cloud resources, virtual machines, and applications. With Site24x7, you can stay on top of your cloud environment and quickly identify and resolve performance issues. Plus, you can customize your monitoring and alerts to fit your specific needs.
Key Features
- Server Performance Monitoring — Track resource utilization, identify bottlenecks, and optimize performance.
- Application Performance Monitoring — Identify and optimize the performance of your applications.
- End-User Experience Monitoring — Identify and troubleshoot issues from the user's perspective.
Pricing
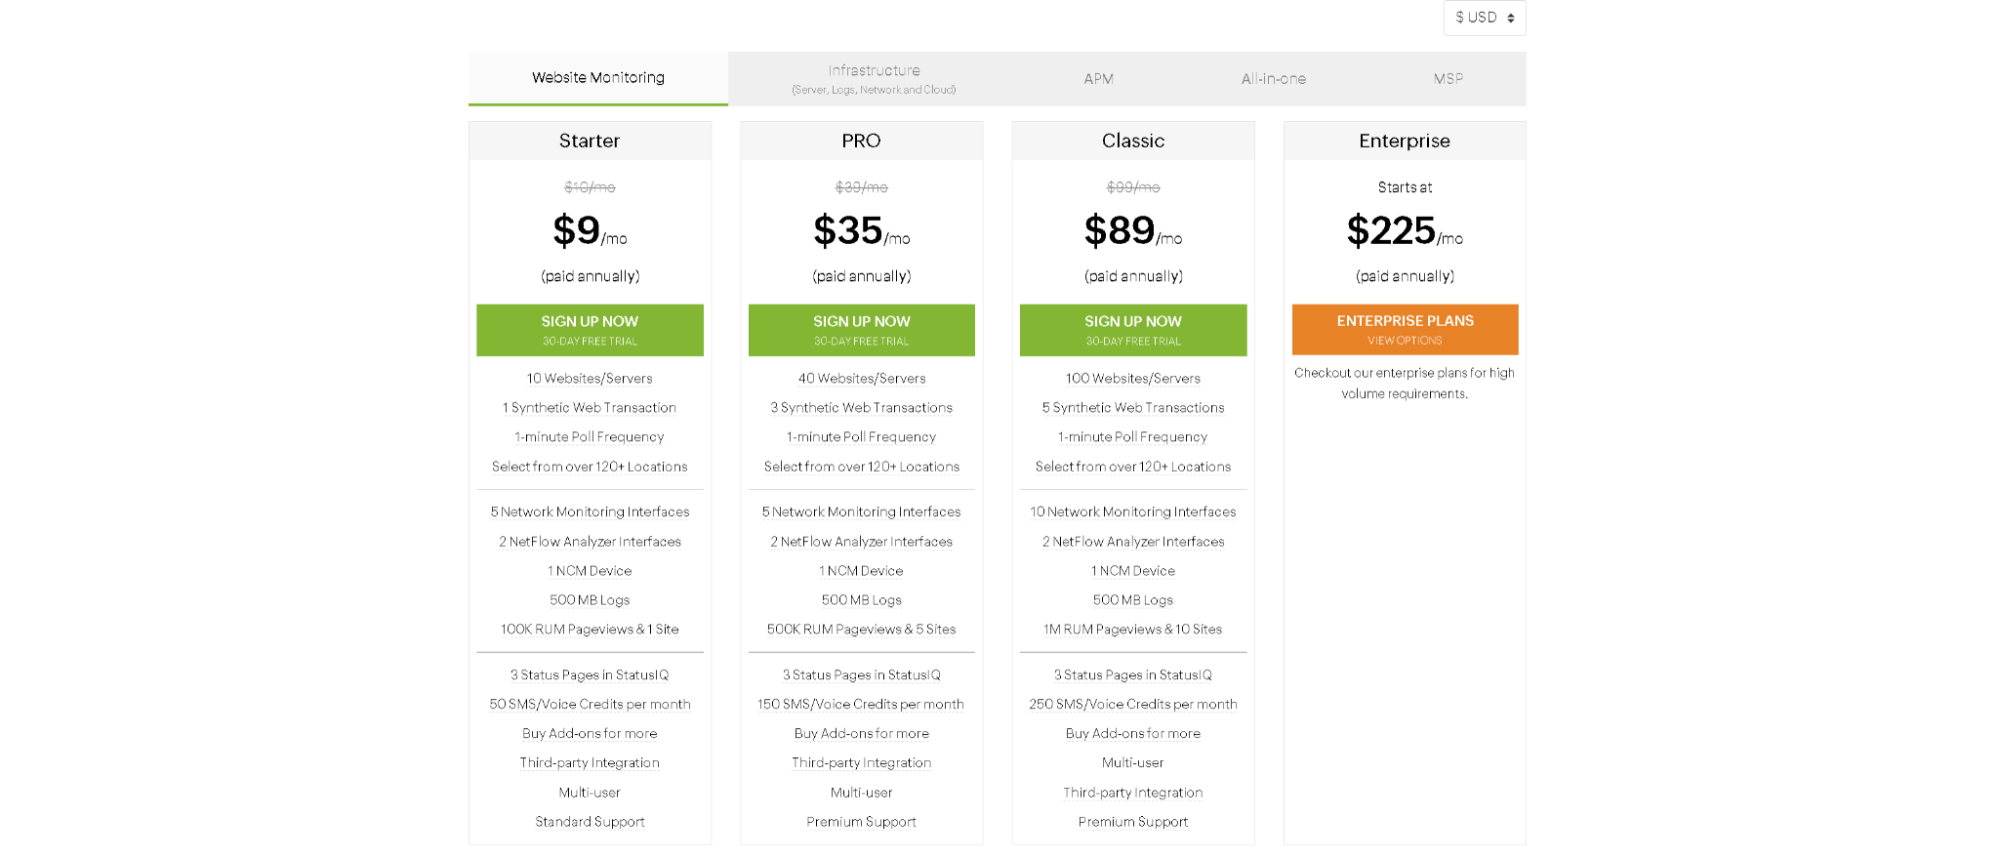
The Basic plan ($9/month) includes pretty much everything you’ll need to monitor up to ten websites and servers. To monitor more, you’ll need to upgrade to Pro ($35/month) or Classic ($89/month).
Pros and Cons
Pros
- Provides reliable uptime monitoring and incident management capabilities.
- Offers a wide range of monitoring capabilities, including server monitoring, network monitoring, and application performance monitoring.
- Provides real-time alerts for performance issues and errors.
Cons
- Can be overwhelming for teams who are new to monitoring.
- Customization options can be limited.
- Pricing can be higher compared to some other tools on the market.
5. Atera: Best for Managed Service Providers (MSPs)
Atera is a cloud-based IT management platform that makes life simpler for IT professionals and managed service providers (MSPs).
With Atera, you can monitor and manage all of your (or your clients') IT infrastructure from a single dashboard. Plus, you can automate annoying busywork like patching, software deployment, and backups. The platform provides remote monitoring and management (RMM) capabilities, so you'll receive alerts when issues crop up, and you can work to resolve them remotely.
Key Features
- Remote Monitoring and Management — Monitor servers and workstations, automate tasks, and resolve issues remotely.
- Patch Management — Keep your servers and workstations up to date and secure.
- Asset Management — Track your hardware and software assets and ensure license compliance.
Pricing
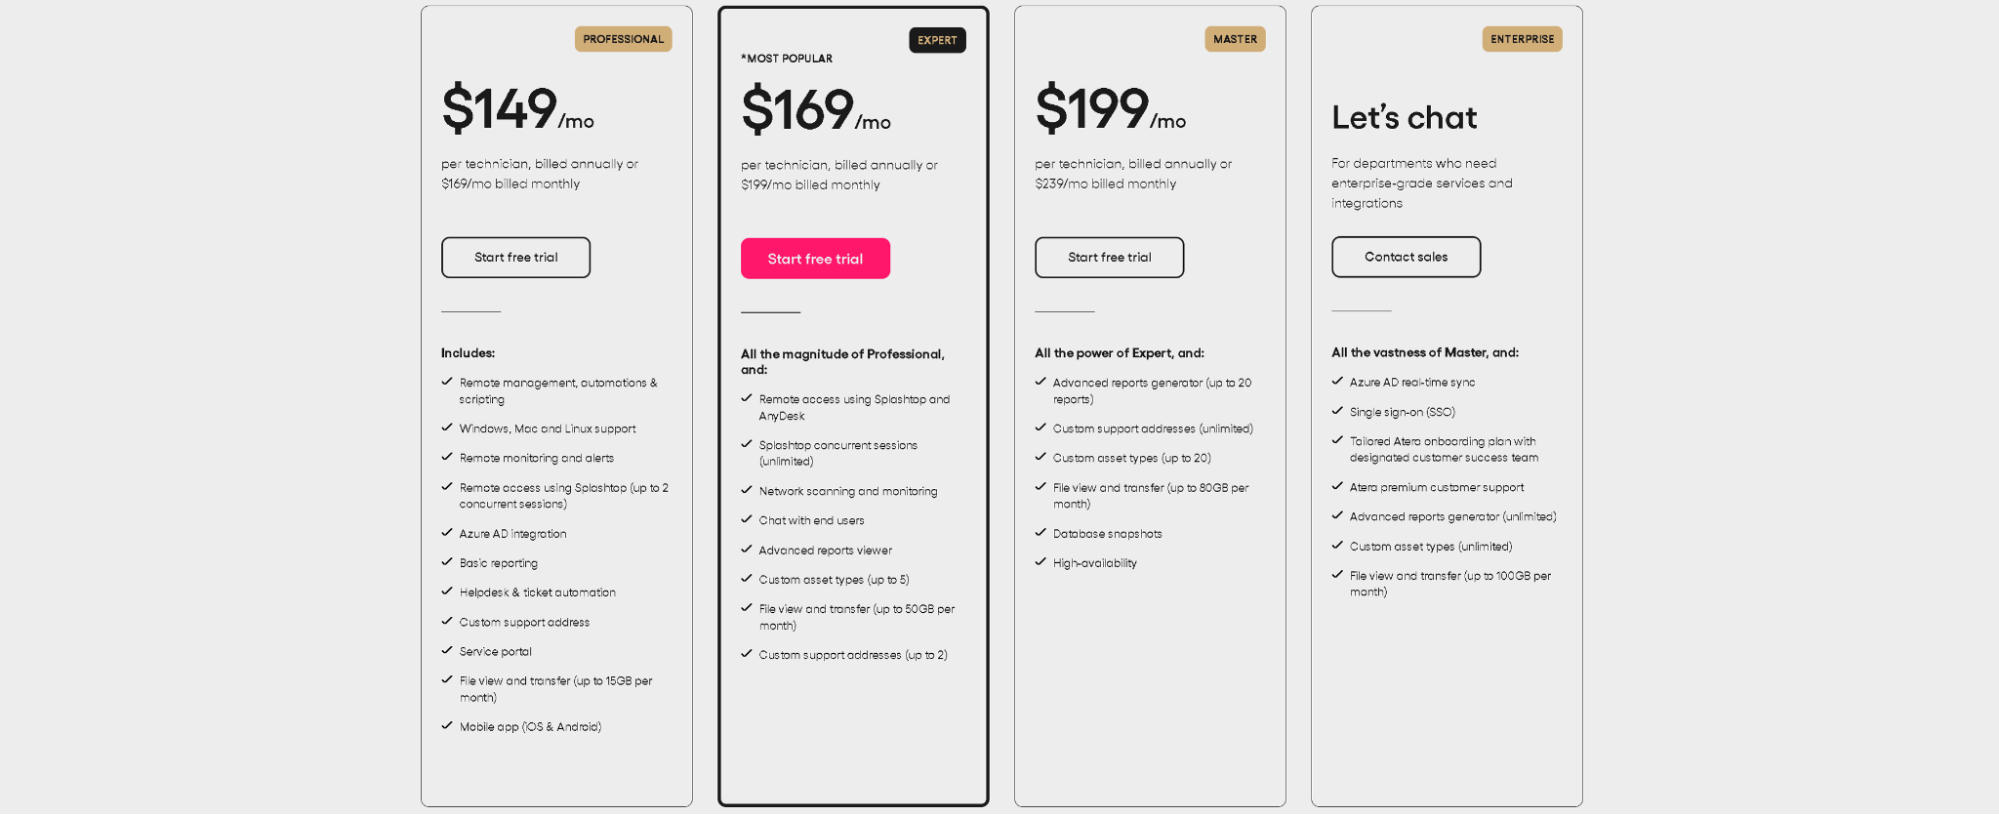
Atera offers four pricing tiers—Professional ($149/month), Expert ($169/month), Master ($199/month), and Enterprise (custom). If you want access to advanced reporting without spending too much, go for Expert.
Pros and Cons
Pros
- All-in-one solution.
- User-friendly interface is easy to use and navigate.
- Provides reliable server performance monitoring.
Cons
- Can be complex and time-consuming to set up and maintain.
- User interface is outdated and can be difficult to navigate.
- Limited capabilities for log monitoring and analysis.
6. Opsview: Best for Customization and Flexibility
Opsview is a monitoring platform that offers advanced features for networks, servers, and applications.
With real-time monitoring, dashboards, and alerts, it helps IT professionals quickly identify performance issues. It's highly customizable and supports a wide range of third-party integrations and plugins, making it a flexible choice for businesses of all sizes. Whether you're looking to monitor a small network or a complex enterprise environment, Opsview is a tool that can help you stay on top of your server performance metrics.
Key Features
- Dynamic Service Discovery — Automatically detect and monitor new services as they are deployed.
- Customizable Dashboards — Get flexible, real-time visibility into server and application performance.
- Automated Remediation — Automatically resolve issues and optimize performance.
Pricing
Opsview has a few different packages available, but the two most relevant ones are Cloud and SMB—both aimed at small-to-medium businesses. You’ll need to contact sales for a quote for the more powerful Cloud, but SMB starts at around $1,000/year for 50 hosts.
Pros and Cons
Pros
- Highly customizable with a wide range of plugins and extensions available.
- Offers comprehensive monitoring capabilities.
- Provides real-time alerts for performance issues and errors.
Cons
- Can be complex and time-consuming to set up and maintain.
- User interface can be difficult to navigate.
7. SolarWinds: Best for Network Performance Monitoring
SolarWinds is a comprehensive network performance monitoring solution that offers real-time visibility into network performance metrics like bandwidth utilization, network latency, and packet loss. It's a great tool for quickly identifying and troubleshooting network issues, with detailed reporting and alerts.
Key Features
- Server and Application Monitoring — Identify and troubleshoot performance issues across your network.
- Network Performance Monitoring — Identify and troubleshoot issues with network devices and connections.
- Virtualization Monitoring — Monitor the performance and availability of your virtual environments.
Pricing
You’ll need to request a quote for Solarwinds, but luckily the company has a great online quote calculator.
Pros and Cons
Pros
- Highly customizable with a wide range of plugins and extensions available.
- Offers comprehensive monitoring capabilities for servers, networks, and applications.
- Provides real-time alerts for performance issues and errors.
Cons
- Can be complex and time-consuming to set up and maintain.
- User interface is outdated and can be difficult to navigate.
- Limited capabilities for log monitoring and analysis.
8. New Relic: Best for Application Performance Monitoring and Analytics
New Relic stands out among server performance monitoring tools for its powerful application performance monitoring features and analytics capabilities.
With real-time monitoring, reporting, and alerts, as well as customizable dashboards and reports, New Relic equips users with the ability to quickly identify and troubleshoot issues. Additionally, the platform supports a wide range of third-party integrations, making it a versatile choice for businesses of all sizes.
Key Features
- Application Performance Monitoring — Identify and resolve issues with your applications.
- Infrastructure Monitoring — Monitor the performance of your servers and network devices.
- Analytics — Understand user behavior, identify trends, and optimize performance.
Pricing
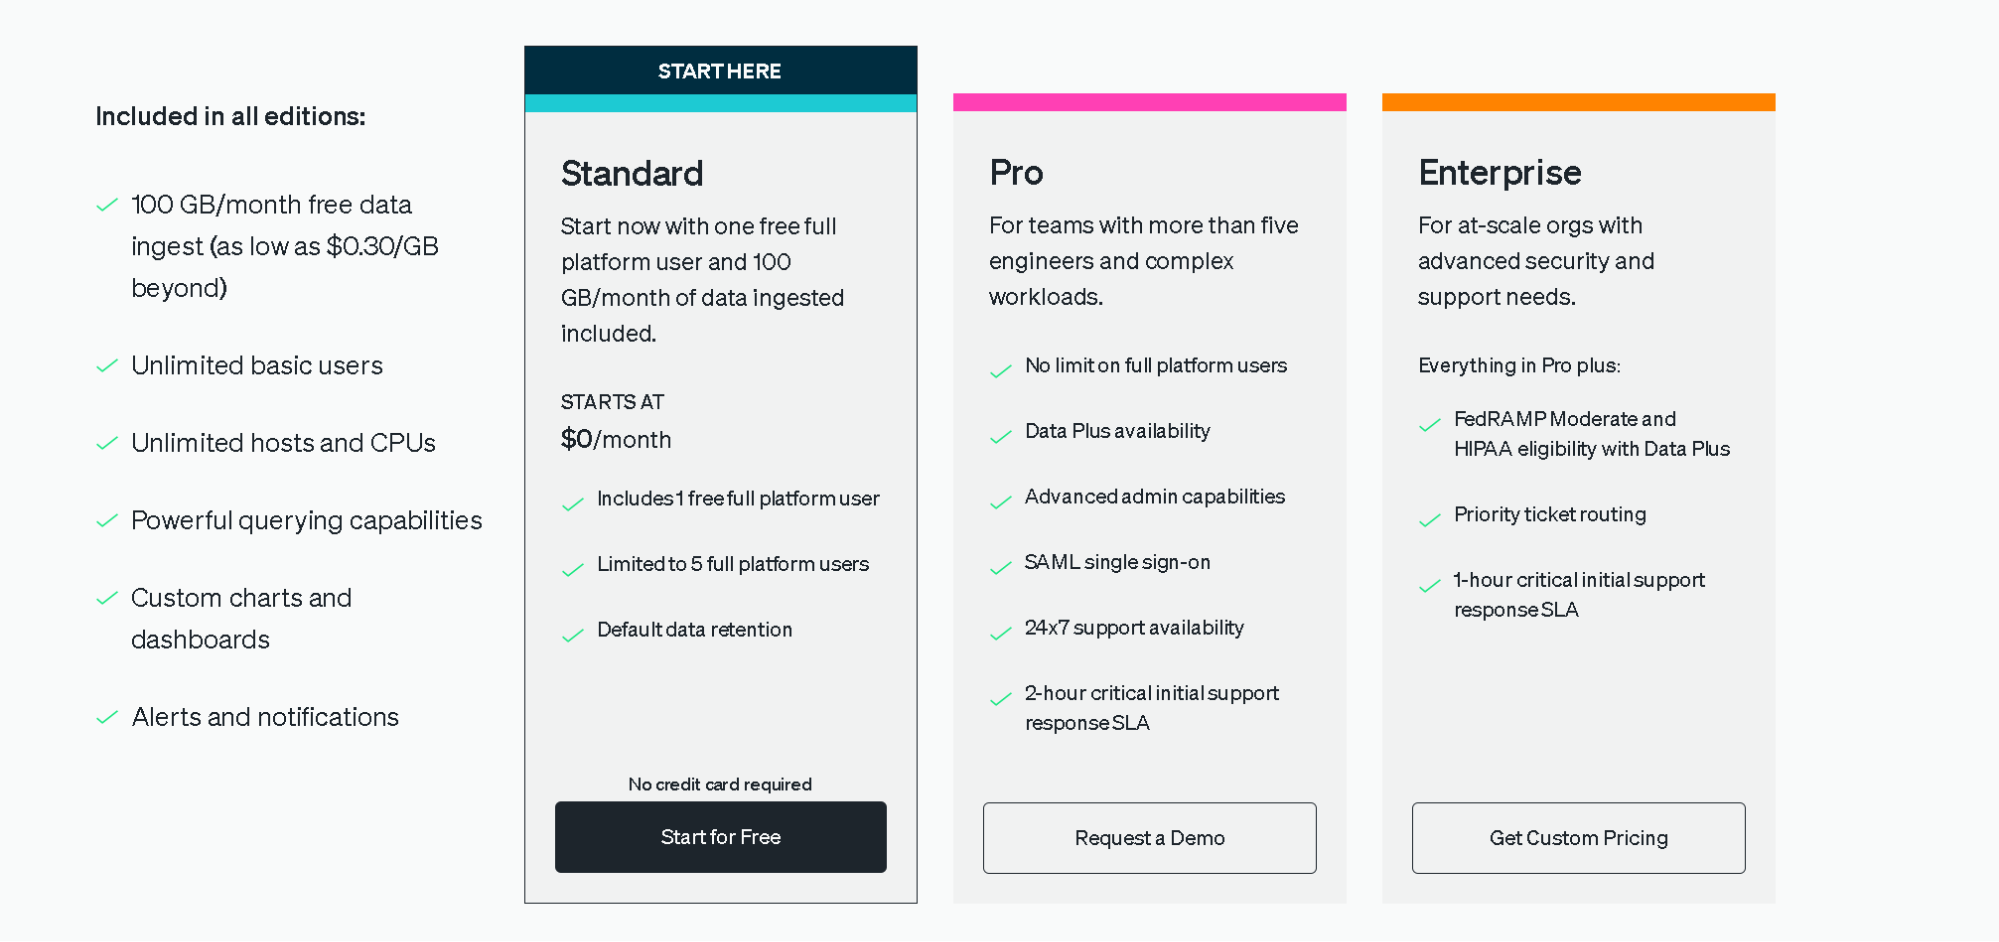
New Relic Standard is free for its most basic features. For access to extra data ingestion and advanced features, you’ll need to request a quote for one of their paid plans.
Pros and Cons
Pros
- Highly customizable with a wide range of plugins and extensions available.
- Offers comprehensive monitoring capabilities for servers, networks, and applications.
- Provides real-time alerts for performance issues and errors.
Cons
- Can be complex and time-consuming to set up and maintain.
- User interface is outdated and can be difficult to navigate.
- Limited capabilities for log monitoring and analysis.
Simplify Server Performance Monitoring With Hyperping
There you have it—eight of the best server performance monitoring tools around.
While there are other great solutions out there, Hyperping stands out thanks to its emphasis on simplicity and reliability. Hyperping lets you monitor your server performance without having to worry about complex setup processes or confusing user interfaces.
It's the perfect choice for businesses that want to keep a close eye on their server performance without getting bogged down in the technical details. So, if you're looking for an uncomplicated, yet powerful server performance monitoring solution, Hyperping is hard to beat.
 Previous post