
As your customer base grows, your responsability to provide a functionning service at all time grows too. Let's see how you can a add a few lines of code and earn peace of mind!
Why would we need a health check endpoint
Firstly, it is dead simple to make one and doesn't require a lot of technical skills. It allows you to monitor this endpoint to get alerted when your API/application goes into trouble.
Major reasons could be:
- SLA — you are often required to keep up with a Service Level Agreement (SLA) that specifies what uptime you need to commit to.
- Money loss — in some industries, a minute of downtime can cost tens of thousands of dollars. How much money and business would you lose for a minute, an hour or a whole day of downtime?
- Reputation — repeatedly downtimes simply tarnish your business reputation.
Here we'll see how to create a health route that is intended to be monitored using an uptime monitoring service, and make sure your application never goes down without a notice, using Node.js as an example using its most popular framework: Express (my favorite).
const express = require('express');
const http = require('http');

const app = express();
const router = express.Router();

router.use((req, res, next) => {
  res.header('Access-Control-Allow-Methods', 'GET');
  next();
});

router.get('/health', (req, res) => {
  res.status(200).send('Ok');
});

app.use('/api/v1', router);

const server = http.createServer(app);
server.listen(3000);
This simply returns a 200 status code with a Ok message in the body response.
Let's add some salt and provide a couple more information:
router.get('/health', (req, res) => {
  const data = {
    uptime: process.uptime(),
    message: 'Ok',
    date: new Date()
  }

  res.status(200).send(data);
});
The process.uptime() method is an built in API of the process module which is used to get the number of seconds the Node.js process has been running.
You could additionally add other connectivity checks such as the database or redis. You should also have one health check for each micro-service that you're running!
Automate the checks
Now that we have a brand new endpoint to check the status of our app, let's collect its uptime and other metrics such as response time, and that we are sure to get notified on time when 💩 hits the fan. You can use a dedicated service like Hyperping which continuously monitors the availability of websites and APIs. Create an account, where you will be redirected to create your first monitor.
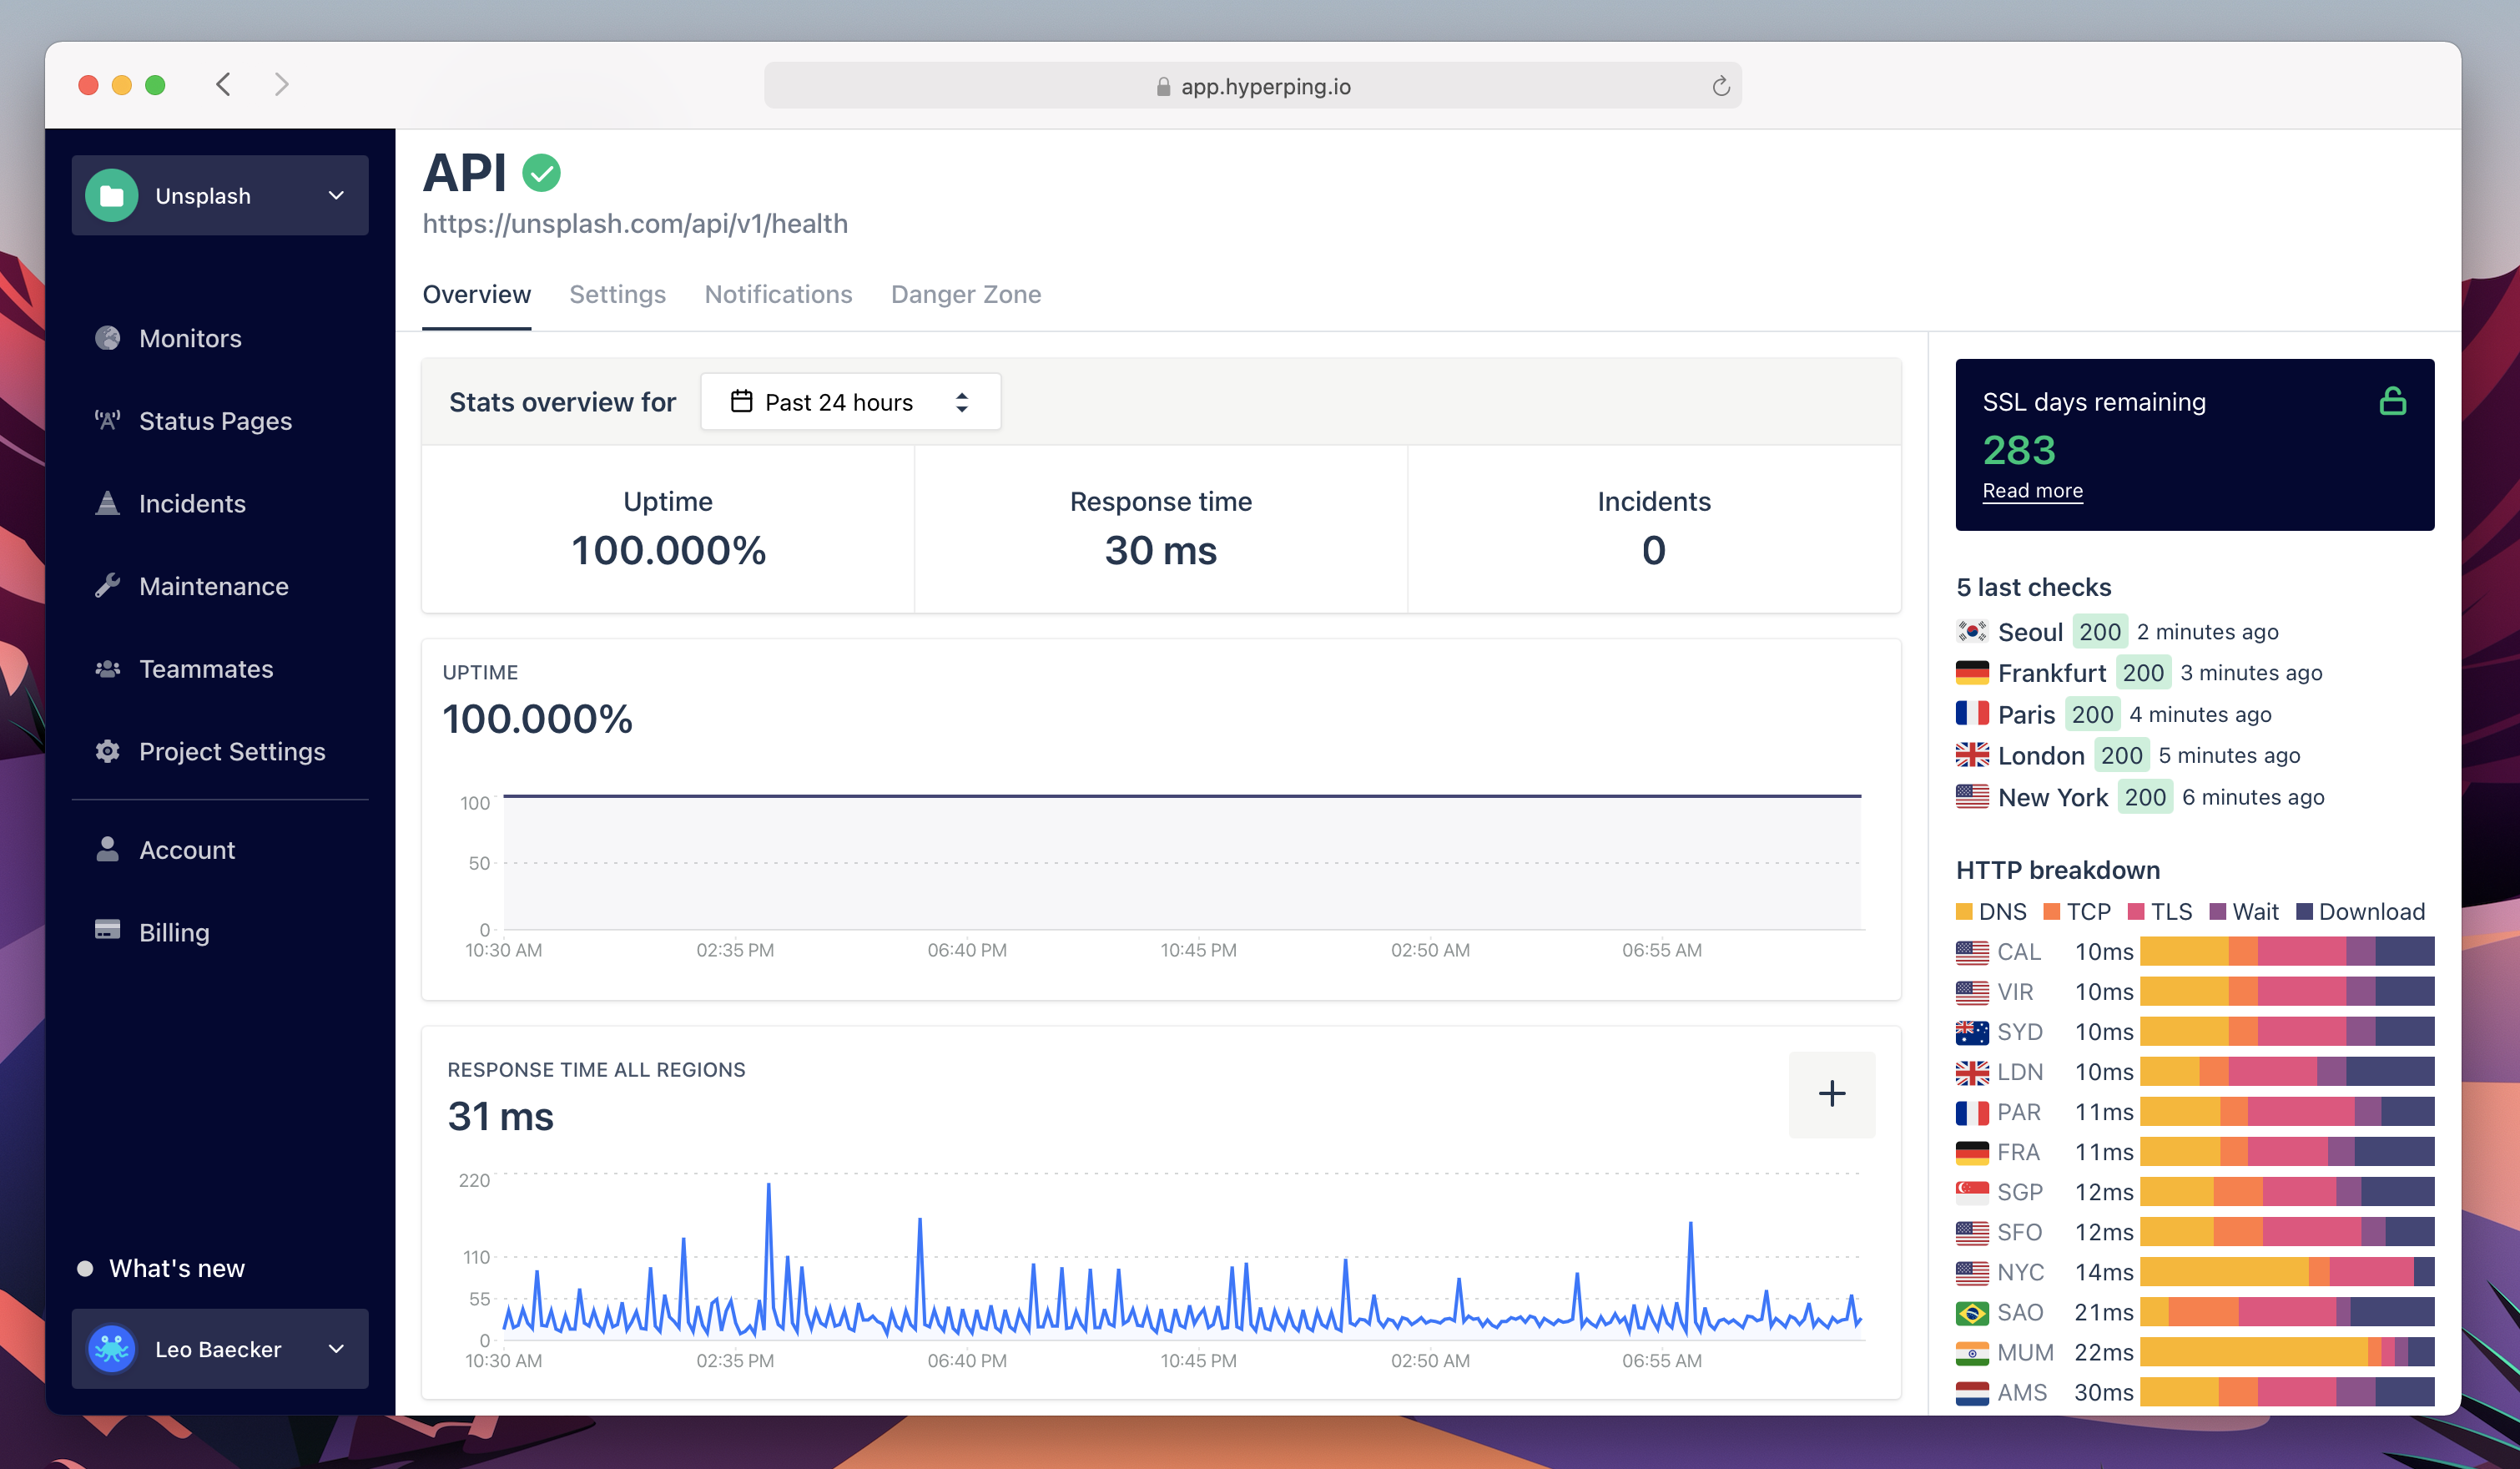
By simply adding the new endpoint to Hyperping's app, with no additional setup, its availability is being continuously monitored. After a few minutes, its uptime and response time are shown for the selected date range across a selectable set of regions (London, Amsterdam, Toronto, San Francisco & more), and displays historical data.
On top of that, it easily integrates with alerting tools such as Slack, OpsGenie, or send SMS to you and your teammates!
Conclusion
This has been a pretty simple and straightforward way to setup a health check! This will give you additionnal peace of mind and can only push you to make your app more robust.
I hope this has been useful for you, please tweet @me after you've setup anything after this, and please share your code snippets of other languages such as Go, Python or Laravel!
 Previous post