

How to create a monitor
The core-value of Hyperping is monitoring. It's the building block of our service and most concepts are associated with monitors.
You can learn more about what is Hyperping and how we perform monitoring here.
To start, head to your dashboard, and click on the "New monitor" card.
Choose a name
Set a human readable name for your monitor. It will appear in your dashboard, email notifications and reports. These names can be edited within a status page.
Examples: "API" or "Website".
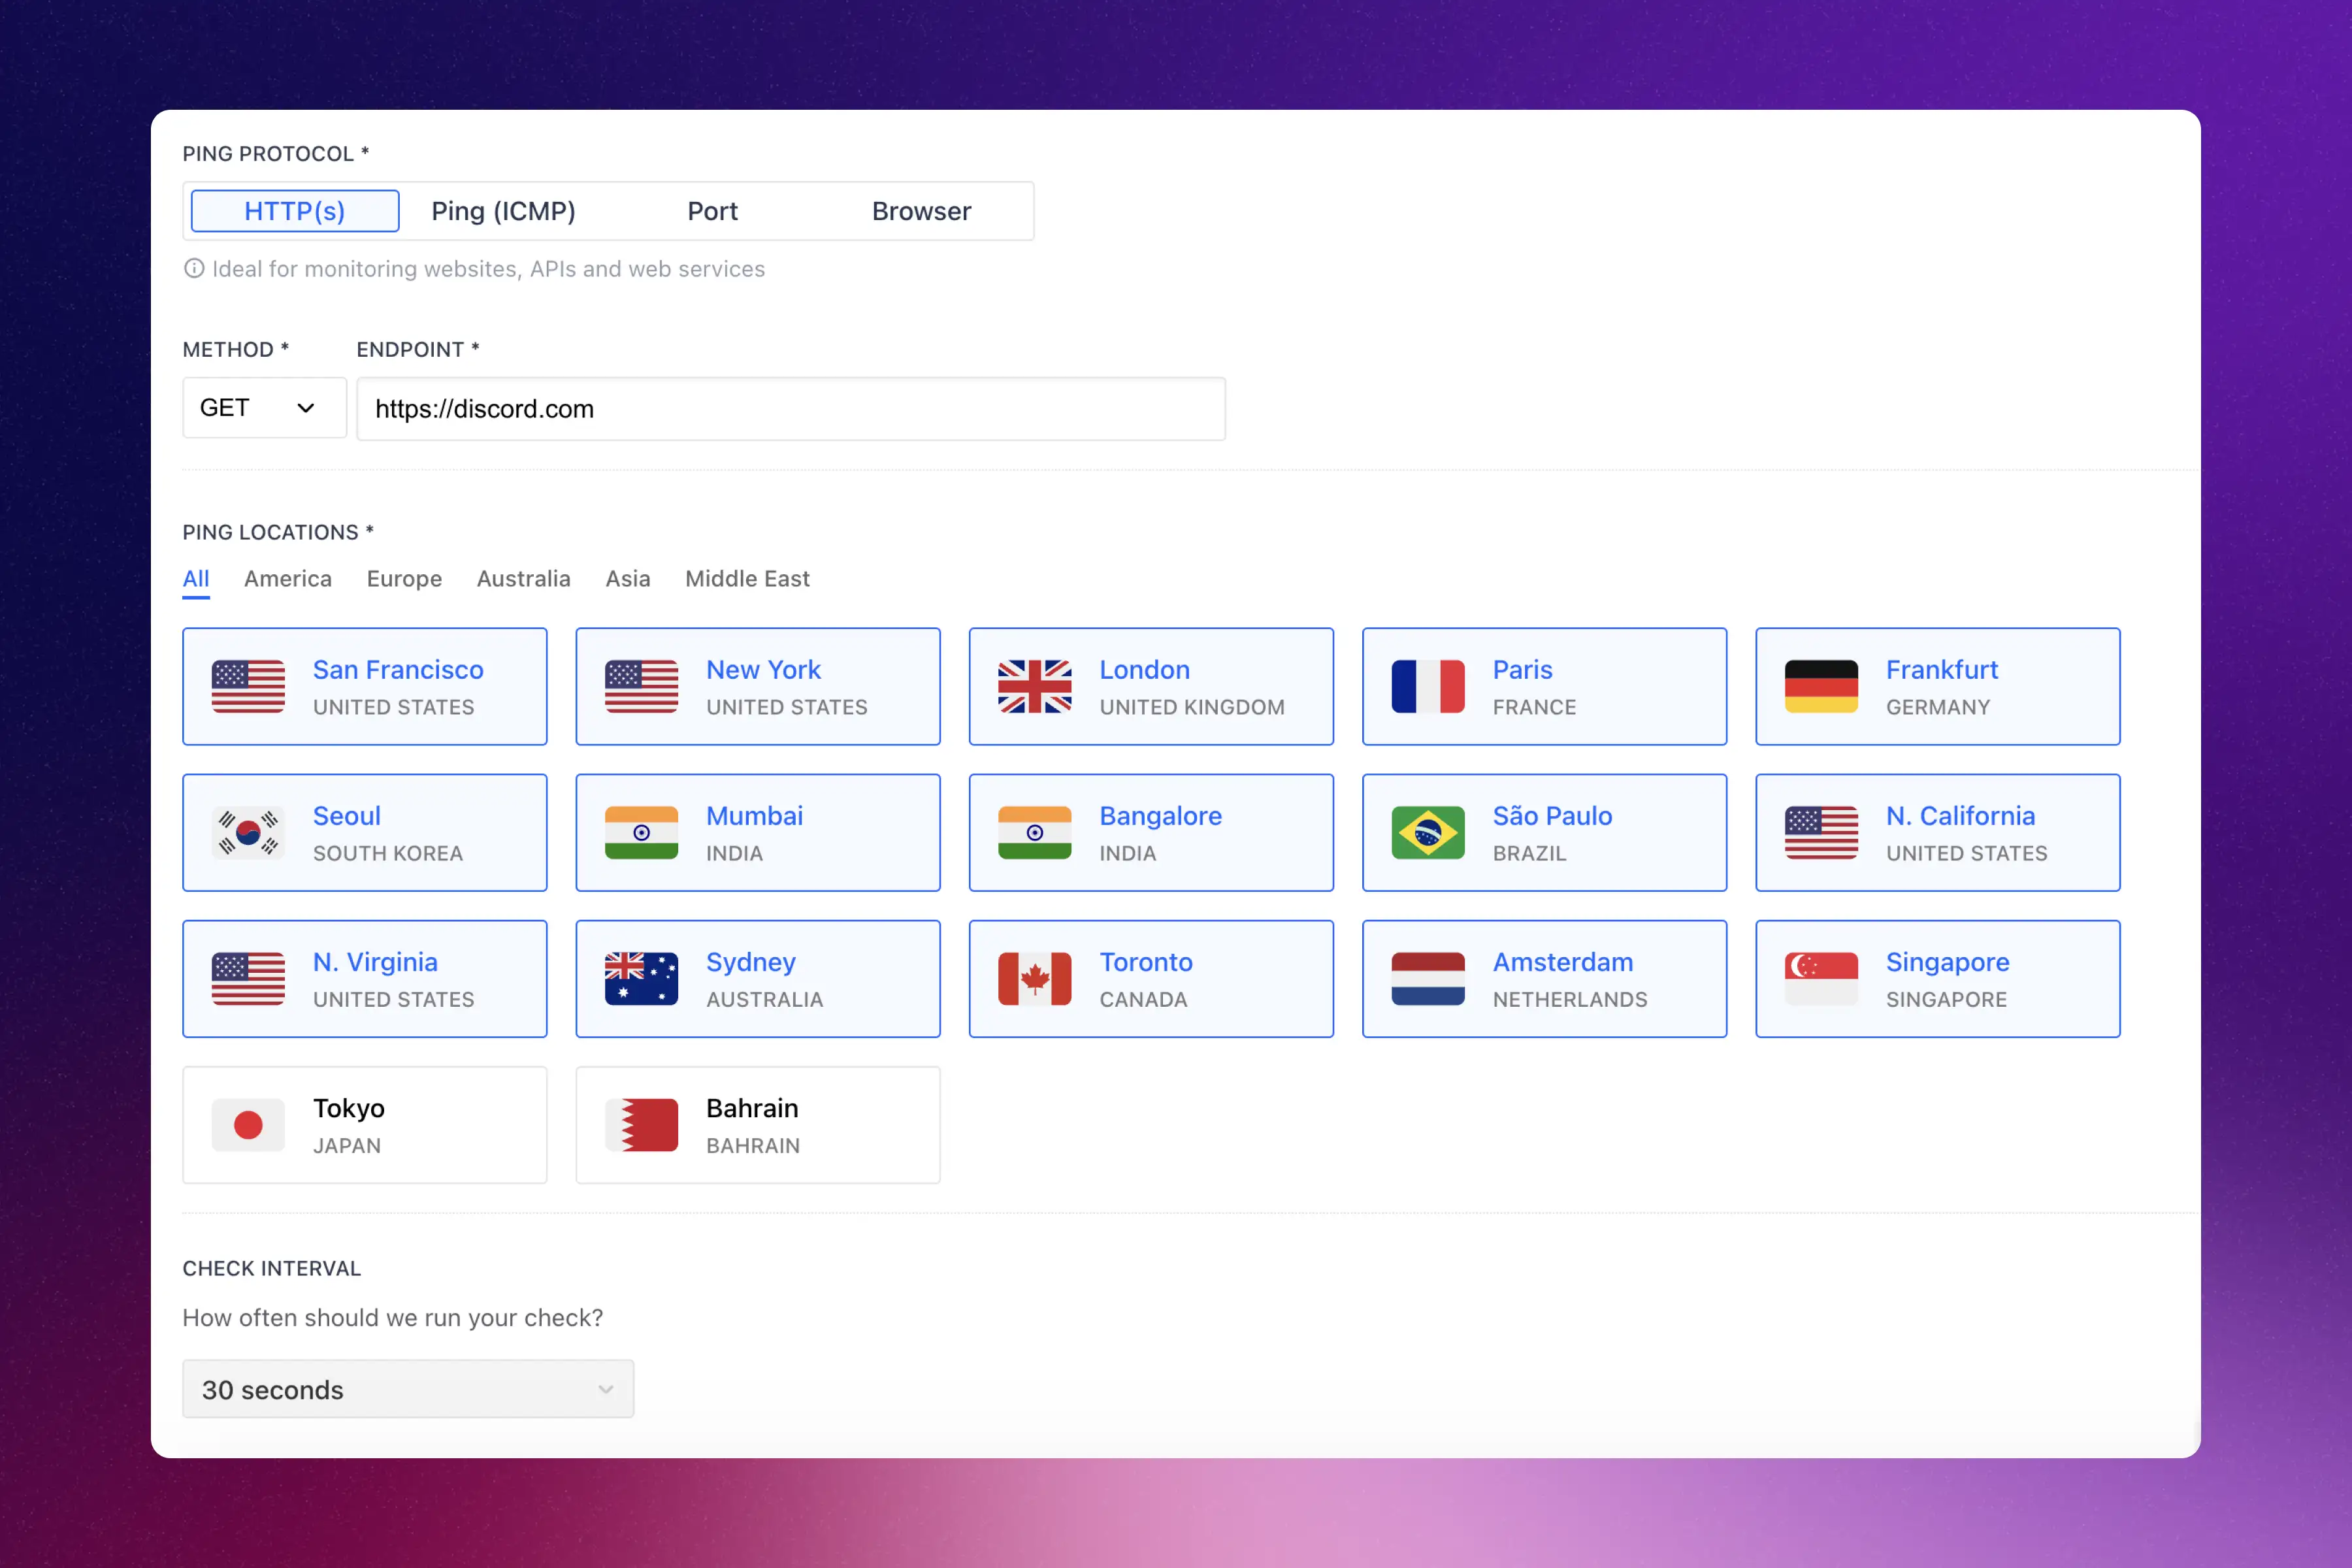
Choose a protocol
Hyperping supports different "protocols": HTTP, ping (ICMP), port or browser checks. The most simple and recurring used protocol is HTTP.
- HTTP — HTTP is the most standard protocol to monitor your services. Whether it is a website or an API, you can monitor their statuses using HTTP. The HTTP request returns a status code, and this is what our systems use to define whether it is up or down.
- ICMP — ICMP performs a simple "echo" request (commonly called pings). The host either returns an echo response (alive) or doesn't.
- Port — Port montiroing constantly check the status of certain ports on your network and quickly detect any changes in status.
- Browser checks — Periodically run your script in a headless browser to perform tasks and get alerted if any error is returned. Learn more here.
Set a host or endpoint
Depending on your protocol, you must pick a host or endpoint where our pingers will perform the checks.
If you picked HTTP, the endpoint must start with either "http://" or "https://". If you picked ICMP or port, the endpoint must be a hostname or an IP address.
Choose regions
Choose where your monitors will be checked from.
Checks are performed from one region at a time. Here is an scenario example:
- Minute 1: Check from Paris: OK
- Minute 2: Check from Frankfurt: OK
- Minute 3: Check from London: Not OK, performing double checks from the other selected regions. If all other regions have a non-positive return, the downtime will be confirmed, and alerts sent.
The regions you selected will impact the response time collections. If your service is mostly hosted in the USA and you are monitoring from european regions, the response time might be increased because of that.
Pick a check interval
Pick the frequency at which your monitor will be checked. Default is 30 seconds. To go lower than 30 seconds, you will need to upgrade to a Business or Enterprise plan.
HTTP advanced settings
Redirects
Select whether your HTTP monitor should follow redirects or not.
Expected status code
For the main use case, users are opting for the default way to monitor uptime: any status code between 200 and 299 (included) will be considered as up.
In other cases, you may have a endpoints that, for example, are unauthorized and should remain unauthorized (401) or forbidden (403) and are yet up and running. You can then select from the list the expected status code that your monitor should respond back.
Text body assertion
Set a text that your response's body must include.
Custom HTTP parameters
You can customize your HTTP's headers and body.
Finalize and save
You can now click the Save button, which will trigger the first ping, compute the metrics and redirect you to the detailed view which includes metrics and graphs concerning your monitor.