If you’re part of the DevOps, SecDevOps, or IT team, you would agree that continuous monitoring of the entire IT systems and networks is vital. And this explains why 70% of businesses treat preventing downtime as a priority to avoid causing significant issues in the future. So monitoring your IT infrastructure constantly with a continuous monitoring plan is one way of improving efficiency and productivity.
For these reasons, Hyperping dives further into the continuous monitoring system and explores the best continuous monitoring tools you need to give your IT team peace of mind. Let’s dive in!
What is Continuous Monitoring?
Continuous monitoring is the process of constantly checking IT infrastructure and systems to identify performance issues, non-compliance, and security threats in real-time. DevOps and IT teams can detect potential threats and problems and fix them at lightning speed.
Continuous monitoring systems gather and process essential data that teams can evaluate, so they can reduce IT downtime proactively.
Why are these Tools Important?
Increase Visibility and Transparency of the Network
Real-time monitoring allows SecDevOps teams to gain valuable insights into IT components, server performance, and network protocols. Automated processes help your teams analyze data throughout the network to ensure nothing slips through the cracks.
Allows for Quicker Responses
An effective continuous monitoring process automates instant alerts via multiple channels, such as SMS, email, pop-up notifications, Slack, and more. It leads to a quick response in resolving issues before they get out of control.
Minimizes System Downtime
When service becomes unavailable or performance problems occur, it’s crucial to respond quickly to minimize downtime and costs. According to a Garner survey, the average cost of IT downtime is $5,600. As a result, a continuous monitoring process can avert this problem.
Criteria to Consider When Choosing a Continuous Monitoring Tool
Is the System Easy to Use?
Some continuous monitoring systems have features that have a steep learning curve, so they need a lot of IT support. Other apps have an intuitive interface with simple and easy-to-use features.
Choose a continuous monitoring tool that lets you try it out through a demo so you can sample the user experience. Also, consider whether the SaaS company offers enough support during onboarding and using the tool.
Alerting features
Ensure that the network monitoring tool has multiple notification capabilities to keep your IT team in the loop regarding outages or network issues. It should provide you with instant alerts via email, Slack, SMS, and so on to help you attend to issues at rapid speed.
Scalability
Select a monitoring solution that can accommodate changes as you add or swap devices. It should be scalable. Network support from the vendor should also be flexible as you incorporate new IT components and systems into your infrastructure.
5 Best Continuous Monitoring Tools
Continuous monitoring requires the best tools to allow you to track your entire IT infrastructure and other technologies. To help you execute your continuous monitoring plan, we have reviewed the top 5 apps below. Let’s get to it!
- Hyperping — Best for Built-in Monitoring Through a Status Page
- OpManager — Best for Network Monitoring
- Zabbix — Best for Monitoring IT Infrastructure
- Paessler PRTG — Best for Monitoring IT Components
- Nagios XI — Best for Monitoring Critical Infrastructure Parts
#1: Hyperping: Best for Built-in Monitoring Through a Status Page
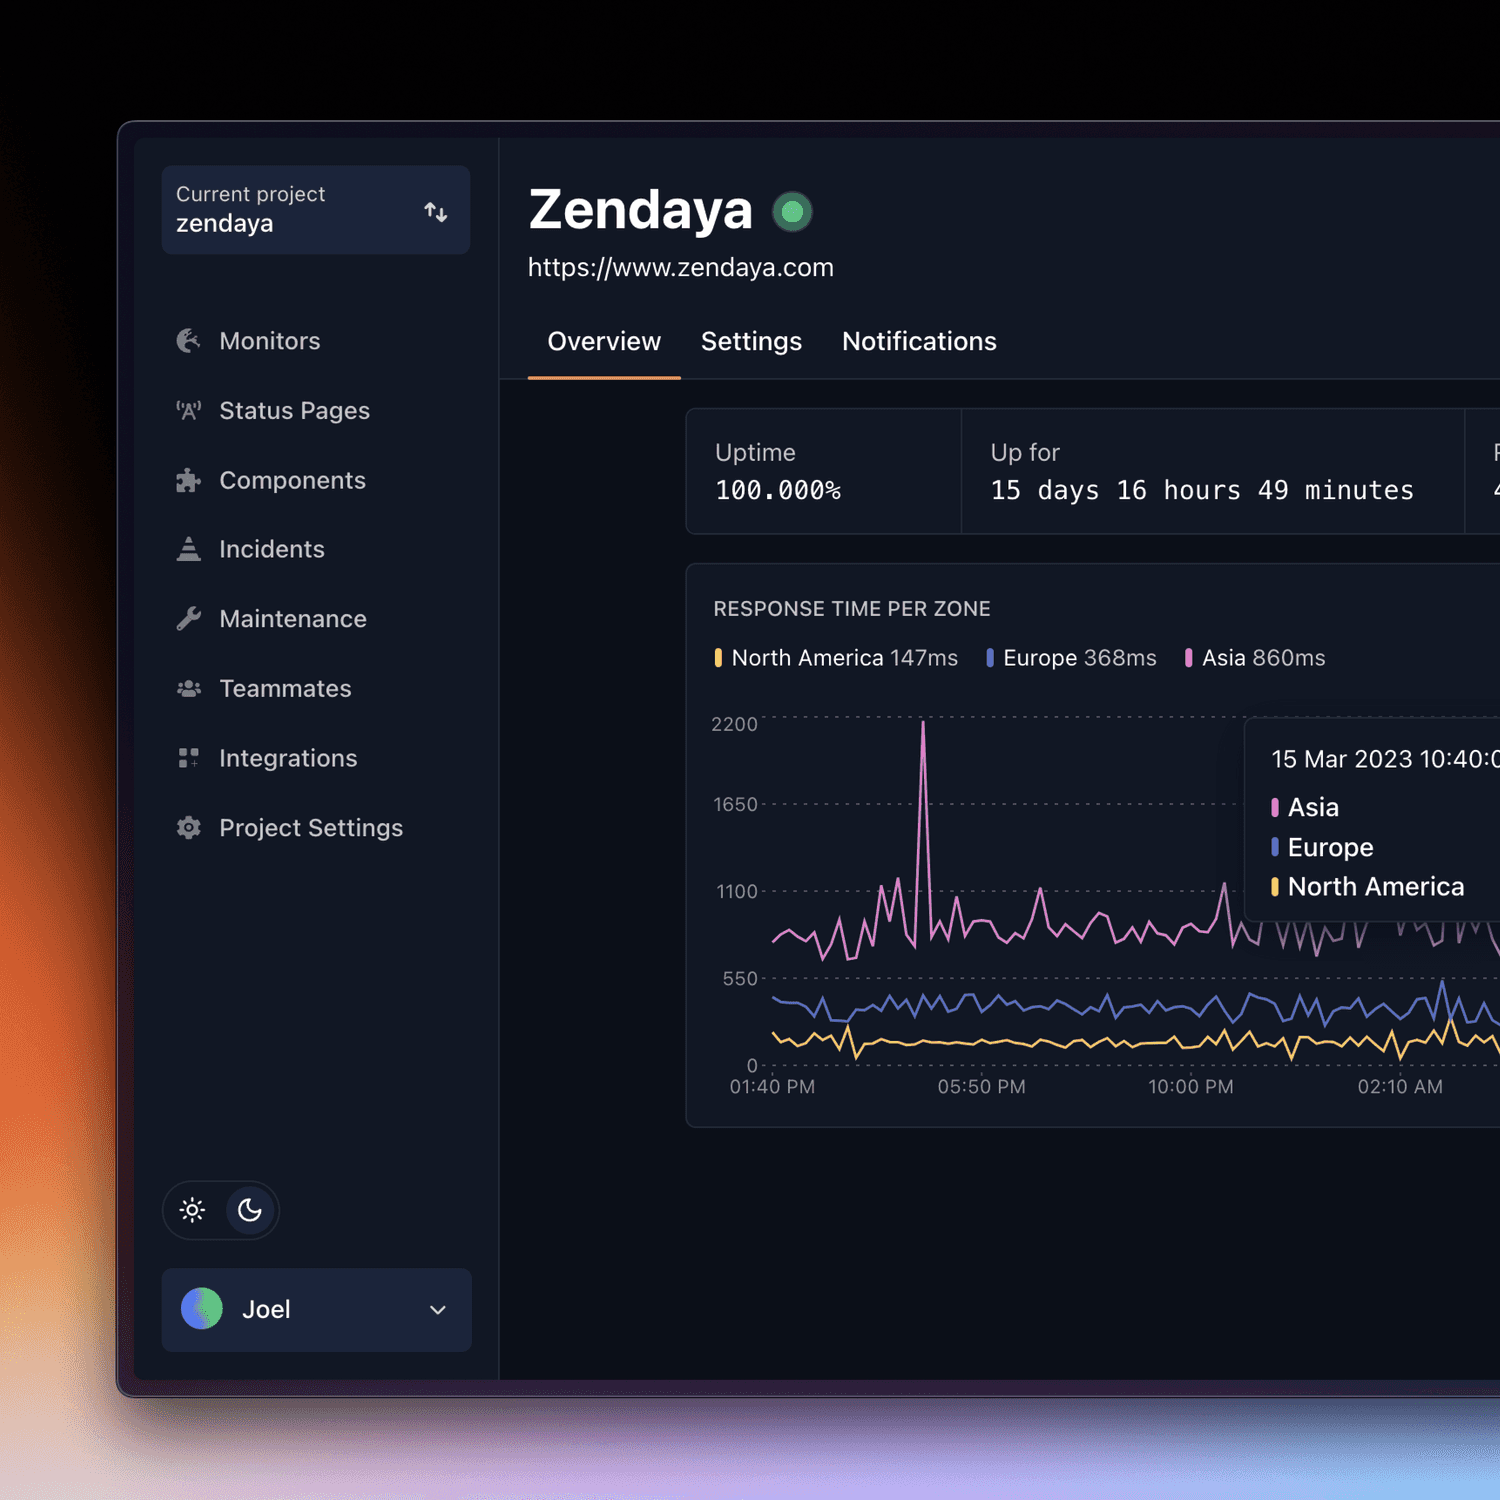
Hyperping is an uptime monitoring platform and status page service that regularly checks a user’s website and APIs against its servers. It has several handy features that let you understand and resolve connection problems in seconds through instant email, Slack, and SMS alerts worldwide.
And if you’re looking to use a simple tool with a modern and user-friendly interface, Hyperping is your best bet. You can also keep your whole DevOps and IT team in the loop with its elegantly hosted status pages and incident management tools.
Features:
- Uptime Reporting: Grasp your downtime and related incidents for a specific period.
- Alerts/Notifications: Get instant feedback on downtime causes to diagnose and fix issues faster via SMS, Slack, Email, and more.
- Real-Time Monitoring: Track and monitor the overall performance of your IT environment.
- Availability Testing: Collect failure events and repair times by automatically running your applications.
- Performance Metrics: Track performance metrics such as availability and response time.
Price:
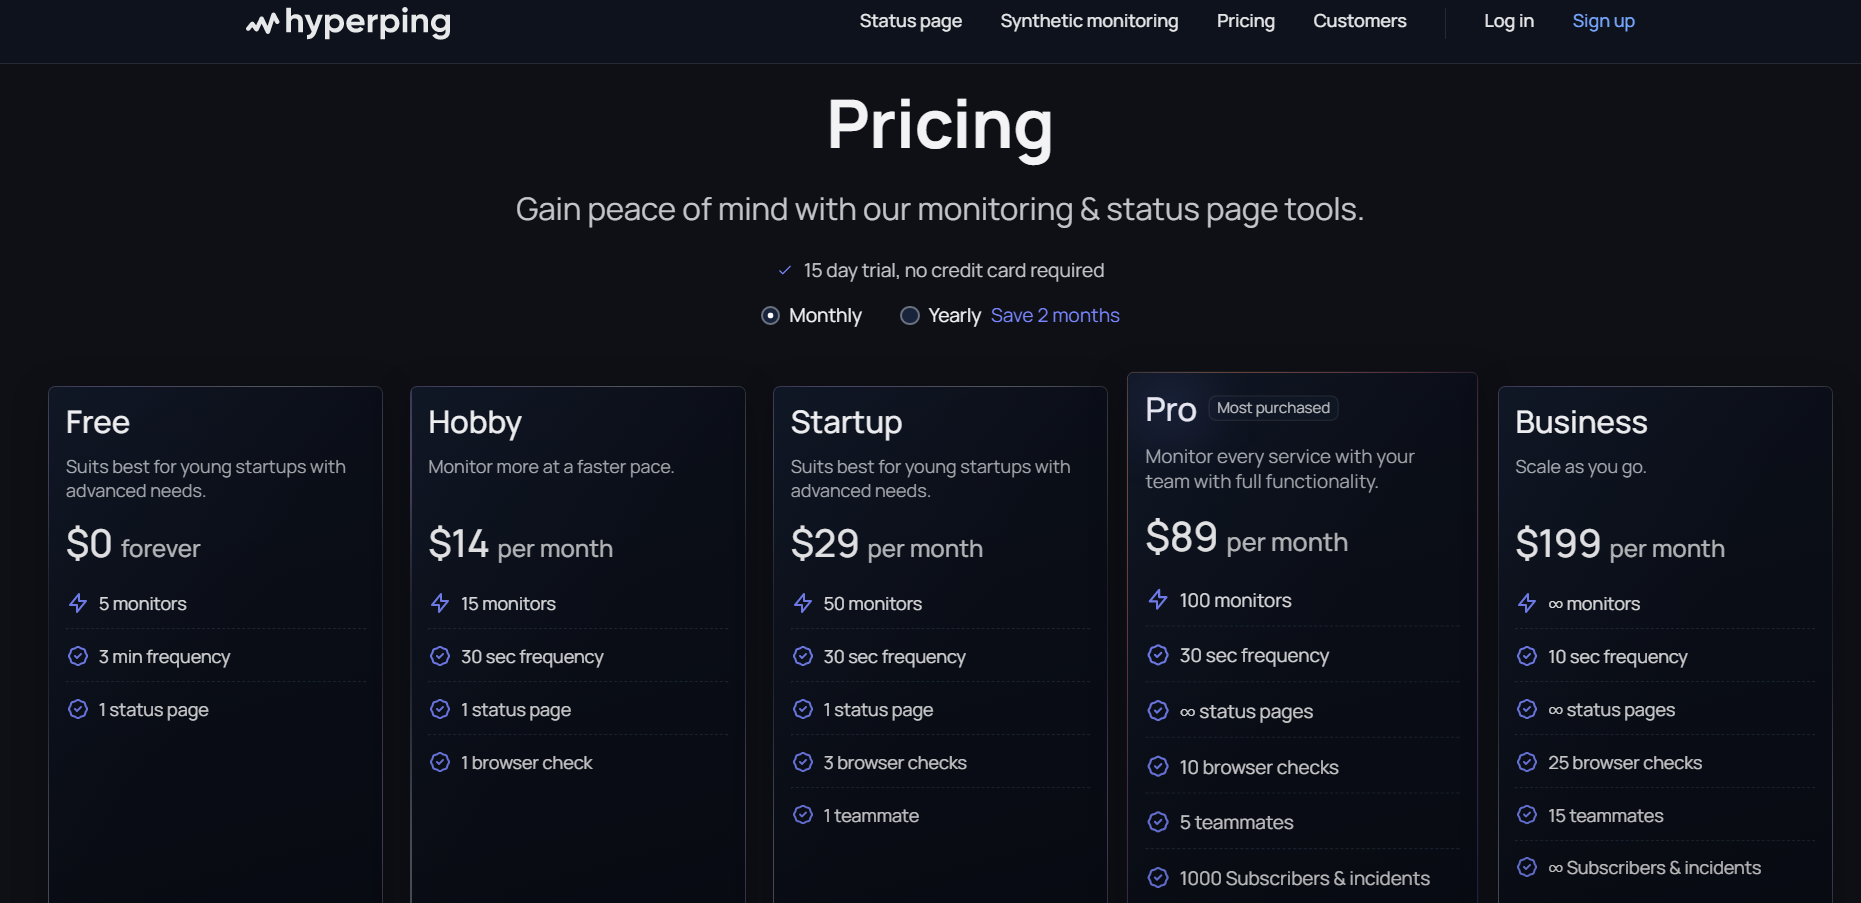
Getting started with Hyperping is as easy as ABC. Start with a free plan that offers one status page, 5 monitors, and 3 minutes of frequency. Get more advanced features with the plans below:
- Hobby ($14/month per 15 monitors) and 30-sec frequency, 1 browser check, etc.
- Startup ($29/month per 50 monitors) plus, 3 browser checks, 1 teammate.
- Pro ($89 per month per 100 monitors and 1000 subscribers & incidents, etc.
- Business ( $199 per month and unlimited monitors, unlimited subscribers & incidents.
Pros
- Offers status page service with built-in monitoring tools
- Simple to use and learn
- Modern and user-friendly interface
Cons
- More integrations could be added
Review
According to several online reviews, several people are satisfied with Hyperping’s performance. They gave the app a 4.8-star rating.
#2: OpManager: Best for Network Monitoring
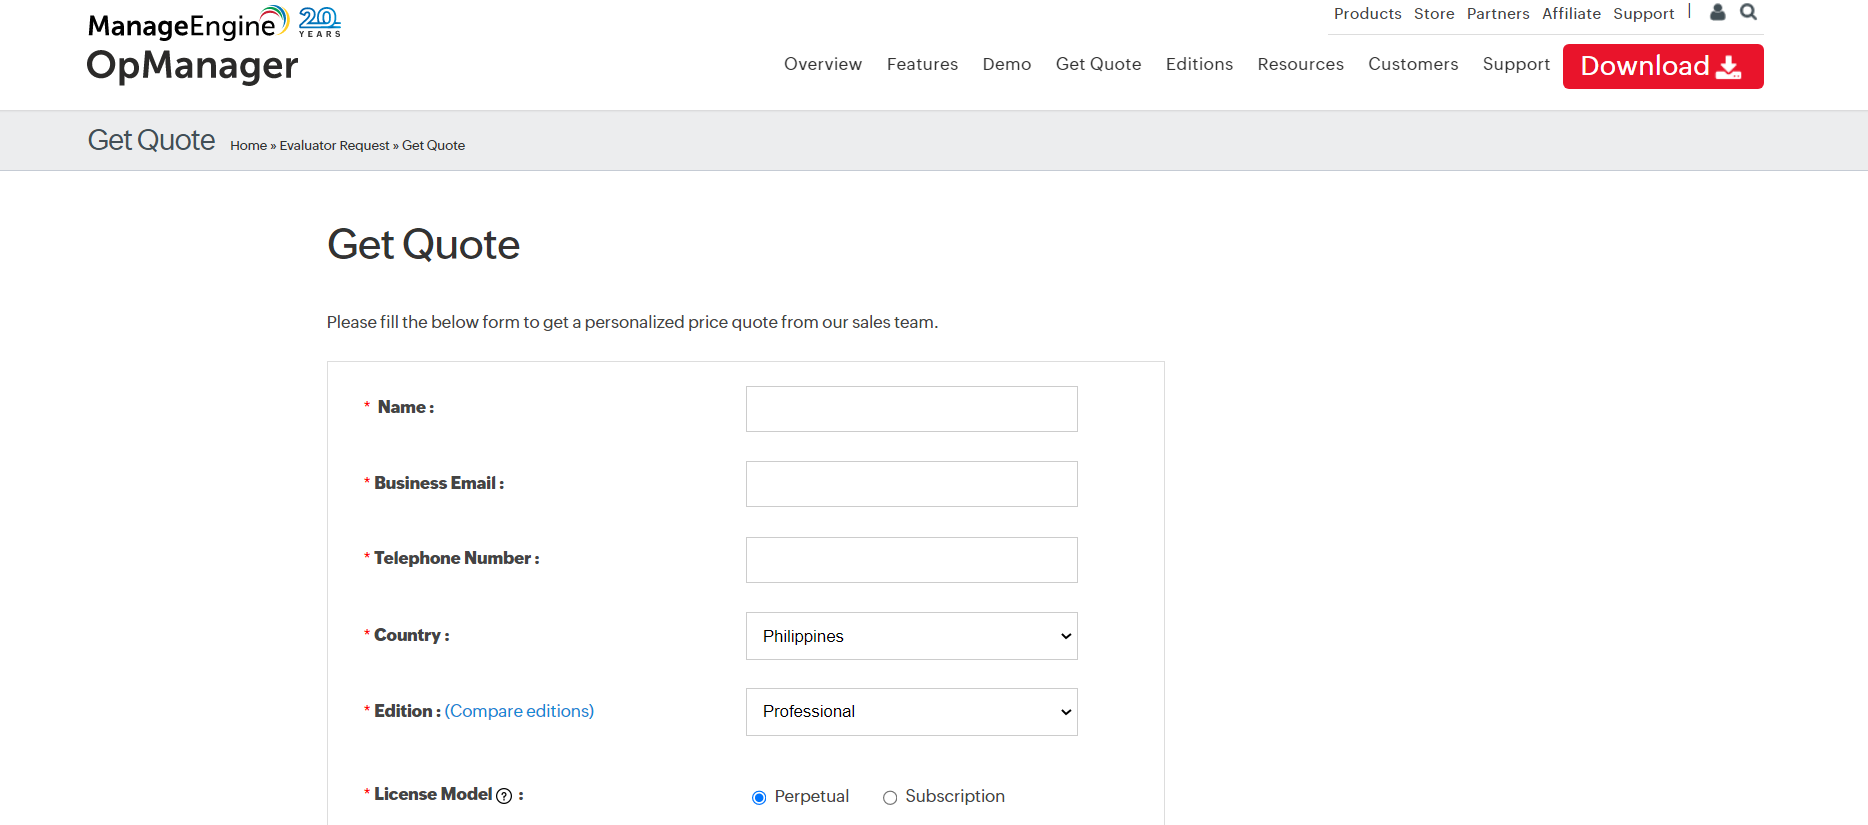
ManageEngine OpManager is a network monitoring application that offers insights into your IT equipment and systems, such as load balancers, VMs, routers, firewalls, storage devices, etc. It’s a network monitoring platform that shows the root causes of issues to help you fix them faster.
Features:
- Network Monitoring Performance: Use dashboards to monitor your network with over 2000 performance metrics.
- Router Monitoring: Track router performance by keeping tabs on errors, temperature, etc.
- Switch Monitoring: Identify devices connected to a port through switch port monitoring and switch port mapping.
Price
You can leverage the above features by requesting a quote from ManageEngine’s website.
Pros
- Real-time alerts
- Preventative alerts
- Easy to use for performance monitoring and managing network operations
Cons
- SNMP custom trap processor needs improvement
- Slow customer support
- Lack of in-depth data orientation compared to other tools
Rating:
According to a 4.4-star rating, hundreds of users are pleased with the software's features and functionalities.
#3: Zabbix: Best for Monitoring IT Infrastructure
Zabbix is a cloud-based and on-site networking monitoring platform. It helps education, healthcare, banking, and the IT sector to track the performance of databases, virtual machines (VMs), servers, etc.
Features:
Performance Monitoring: Track your network performance regularly. Alerting: Update your IT team through texts, calls, and pop-up notifications about network issues and failures. Multi-Network Capability: Monitor multiple networks at the same time.
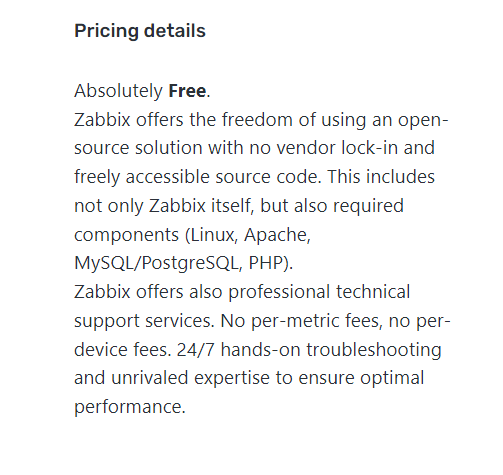
Price
Zabbix is an open-source platform that is available to users for free.
Pros
- Easy to configure
- Web-based interface
- Centralized monitoring
Cons
- Lacks a detailed UI/UX
- More templates for rich monitoring needed
- Limited customer support
Rating:
According to online reviews, many users say the monitoring tool helps them meet their goals. It has a 4.4-star rating.
#4: Paessler PRTG: Best for Monitoring IT Components
PRTG is an on-premise and cloud-based monitoring tool that caters to businesses of all sizes. It allows you to monitor your entire IT infrastructure and other technologies, including SNMP, SSH, traffic analysis, etc. The tool has several tools, like data publishing, alerts, bandwidth monitoring, and reporting.
Features:
- Real-Time Analytics: Create real-time in-depth analytics about monitored systems activity.
- Observability: Generate insights into IT systems utilizing event metrics, logging, traces, and metadata. Grasp your IT systems performance through logging, event metrics, metadata, and traces.
- Diverse Systems Monitoring: Track activity and usage across multiple IT systems such as networks, databases, and servers.
Price
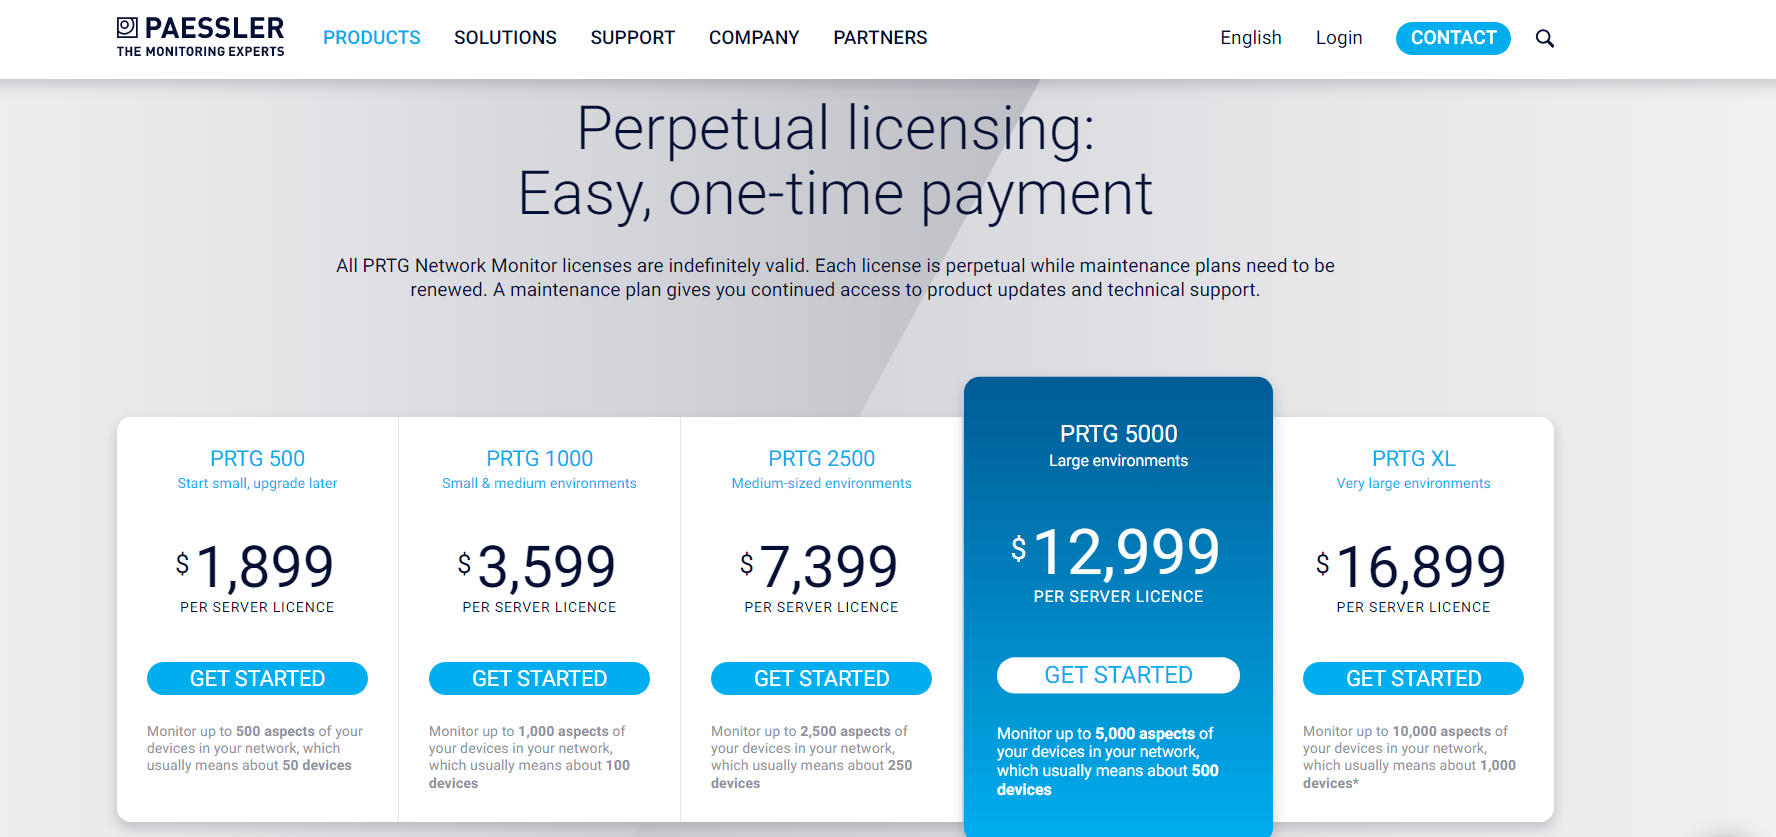
Paessler PRTG offers five pricing packages, as shown below:
- PRTG 500 ($1,899 per server license) including monitoring 500 aspects of your devices in your network.
- PRTG 1000 ($3,599 per server license) and monitoring 1000 aspects of your devices in your network.
- PRTG 2500 ($ 7,399 per server license) and tracking 2500 aspects of your devices in your network.
- PRTG 5000 ($12,999 per server license) and monitoring 5000 aspects of your devices in your network.
- PRTG XL ($18,899) per server license) and tracking unlimited aspects of your devices in your network.
Pros
- User-friendly interface
- Possible to create sensors
- Customizable Dashboards
Cons
- Steep learning curve during setup
- Dashboard maker needs more features
- Control of users' permissions needs improvement
Rating
PRTG has received a 4.6 rating, according to Gartner reviews.
#5: Nagios XI: Best for Monitoring Critical Infrastructure Parts
Nagios XI is a server monitoring application that enables businesses to monitor network protocols, services, and operating systems. Users can receive alerts regarding outage issues via text messages and email, so they can improve the customer experience.
Features
- IT Infrastructure Monitoring: Monitor all types of IT infrastructure components, such as system metrics, operating systems, network protocols, etc.
- Customizability: Use GUI to give your customers the freedom to customize layout design and preferences.
- Extendable Architecture: Connect your favorite in-house apps or third-party applications through multiple APIs.
Price
Nagios has the following pricing plans:
- Standard Edition: ($1,195) and easy configuration wizards, GUI configuration
- Enterprise edition: ($ 3,495) plus everything in the standard edition plus, scheduled reports, and capacity planning reports

Pros
- Network monitoring
- Database monitoring
Cons
- Interface needs improvement
- Small selection of dashlets to construct new views
- Master Node is configurable on the LINUX platform only
Rating
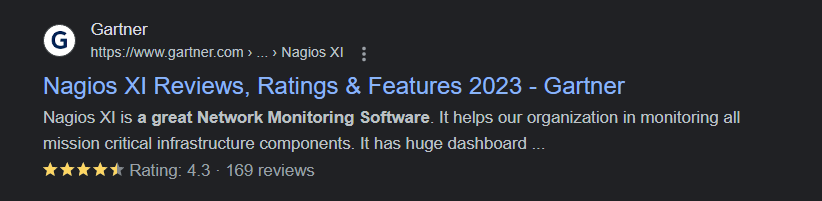
Nagios XI received a 4.3-star rating based on the Gartner online reviews, indicating that many users are satisfied with its performance.
Take Your Monitoring to Another Level with the Best App
Continuous monitoring has massive benefits for your DevOps, SecDevOps, and IT teams because it enables you to respond and resolve issues promptly. And that’s why an uptime monitoring platform, Hyperping, provides a simple but powerful status page service with built-in monitoring features to track your IT infrastructure and systems.
With Hyperping, you can keep everyone on your team in the know with instant alerts by email, SMS, and Slack. As a result, you can reduce IT downtime and associated costs. Getting started with Hyperping is hassle-free. Sign up with your email or Google account to try out the software.
 Previous post